Key Takeaways:
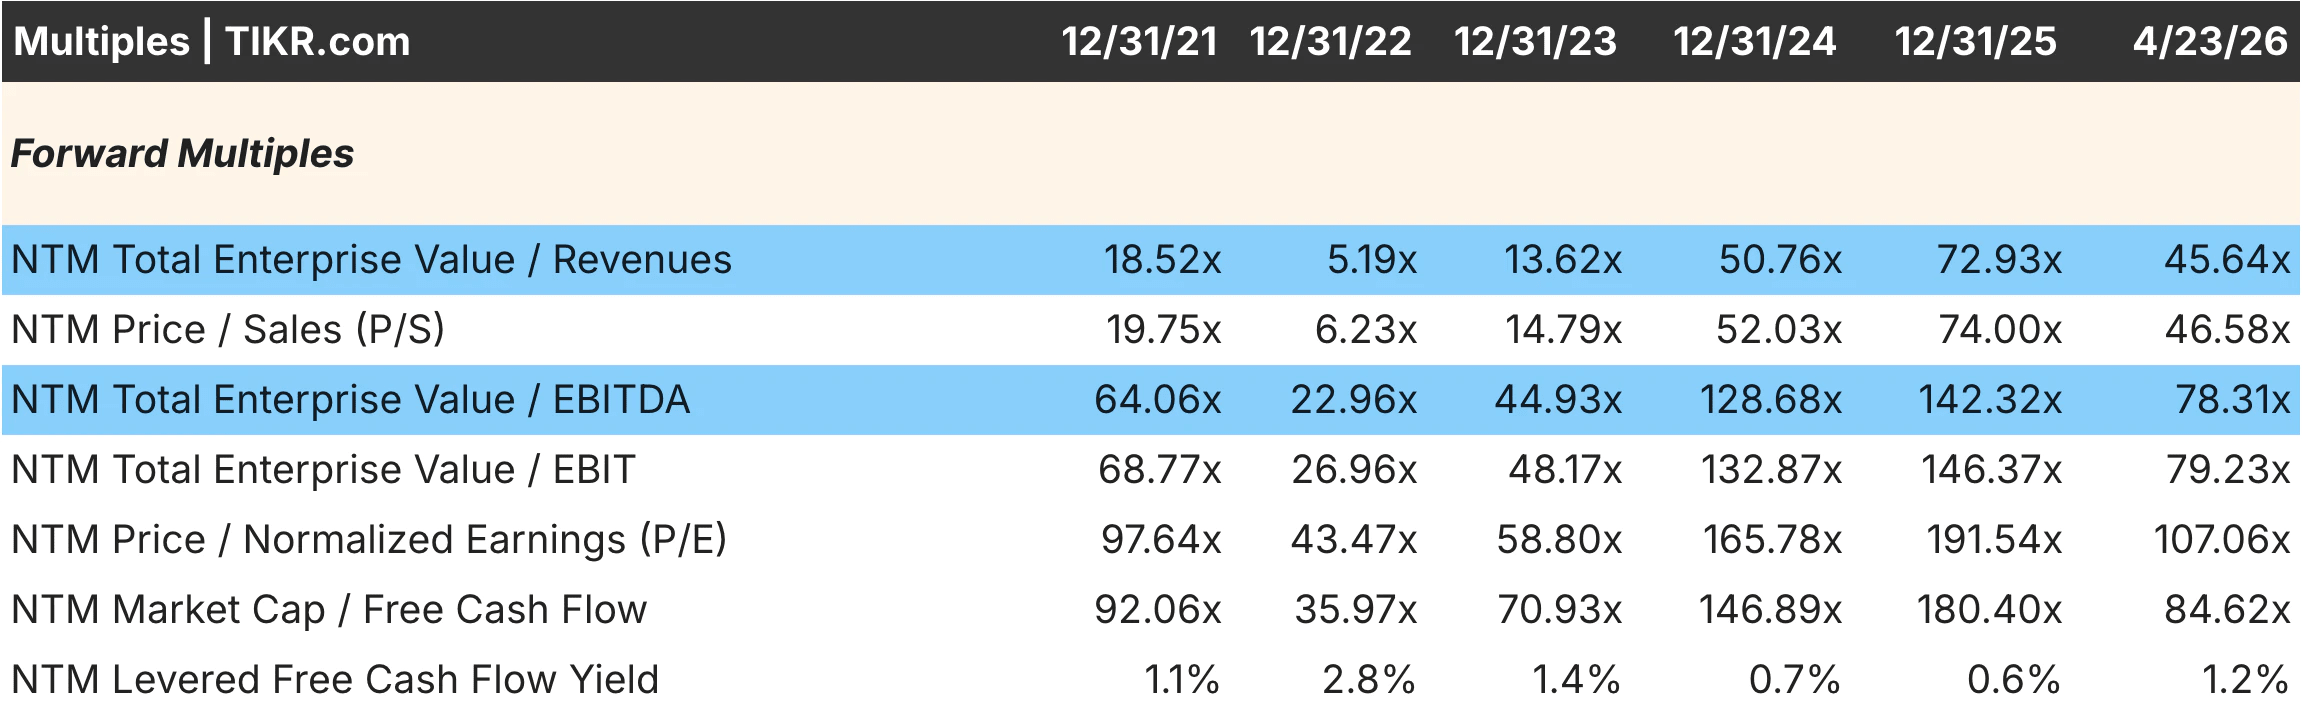
- Palantir trades at approximately 107x forward P/E and 78x forward EV/EBITDA today, a premium that has compressed from its peak of 142x EV/EBITDA in late 2025 but still represents one of the richest valuations in the entire software sector, while NVIDIA trades at roughly 24x forward P/E and 19x EV/EBITDA after its own significant compression from peak levels.
- The revenue multiple gap is the most striking data point in this comparison: Palantir trades at approximately 46x forward EV/Revenue versus NVIDIA’s roughly 13x, meaning investors are paying three and a half times more per dollar of revenue than NVIDIA, despite NVIDIA growing faster in absolute terms.
- Palantir’s operating margin improved from negative 26.66% in 2021 to positive 31.59% in 2025, one of the most dramatic margin inflections in enterprise software history, while NVIDIA’s operating margin expanded from 20.68% in early 2023 to approximately 60% by early 2026 as AI chip demand overwhelmed supply.
- Under mid-case assumptions, TIKR’s model suggests Palantir could deliver approximately 239% total upside through 2030 at roughly 30% annualized returns, while NVIDIA implies approximately 151% upside through 2031 at roughly 21% annualized returns, with the difference reflecting both Palantir’s higher growth-rate assumptions and its higher starting-multiple risk.
Now Live: Discover how much upside your favorite stocks could have using TIKR’s new Valuation Model (It’s free)>>>
This is the most debated pairing in AI investing right now. Software versus hardware, sticky government contracts versus data center dominance. One stock trades at 107x forward earnings, while the other trades at 24x.
The surface-level framing makes Palantir sound expensive, and NVIDIA sound cheap. But the real question is more nuanced: what does each stock need to deliver to justify its price, and which one has a more realistic path to getting there?
Estimate a company’s fair value instantly (Free with TIKR) >>>
A Software Bet vs. a Hardware Bet on the Same Megatrend
Palantir (PLTR) builds AI and data analytics software for government agencies and large enterprises. Its platforms, Gotham and Foundry, are deeply embedded in customer operations after years of implementation, creating switching costs that most SaaS companies never achieve. The newer AIP platform is expanding commercial reach by making AI deployment accessible without deep technical teams.
NVIDIA (NVDA) designs the GPUs that power the vast majority of AI training and inference globally. Its CUDA ecosystem has created developer lock-in that goes well beyond the hardware itself. The company outsources manufacturing to TSMC while capturing extraordinary margins on chip design, a model that has proven remarkably scalable as AI demand has grown.
The core distinction is revenue character as Palantir’s contracts are sticky, recurring, and government-backed. NVIDIA’s revenue is growing faster and at higher margins today, but is more exposed to the inherent cyclicality of data center capital spending.
The Valuation Gap Is Wide. The Growth Gap Is Narrower Than It Looks.
Palantir’s forward EV/Revenue of roughly 46x peaked at 72.93x in late 2025 and has compressed, but it still sits at a level that prices in decades of compounding. The forward P/E of 107x and EV/EBITDA of 78x are among the highest multiples carried by any large-cap stock in the market today.
NVIDIA’s forward EV/Revenue of roughly 13x has also compressed from a peak of 19.51x in early 2025. At 24x forward P/E for a business growing at 70% with 60% operating margins, that compression has created a meaningfully better entry point than existed twelve months ago.

What makes the comparison interesting is that analysts project similar near-term growth rates. Palantir at roughly 62% revenue growth in 2026 and NVIDIA at roughly 72% are not that far apart. The premium Palantir commands is not about faster growth today. It is about the market’s conviction that software economics compound more durably than hardware over a decade.
One Margin Story Is Just Getting Started. The Other Is Near Its Peak.

Palantir’s margin trajectory is genuinely impressive. Operating margins moved from negative 26.66% in 2021 to positive 31.59% in 2025, a nearly 60-percentage-point swing driven by revenue scaling against a largely fixed cost base. Gross margins held steady above 80% throughout, confirming that the underlying unit economics were always there. At 31.59%, there is still a meaningful runway toward the 40%-50% range that mature enterprise software companies achieve.

NVIDIA’s margins tell a different story, as operating margins fell to 20.68% in early 2023 before surging to approximately 60% by early 2026, as AI chip demand created pricing power amid constrained supply. Gross margins peaked near 75% before modestly compressing to 71% as the product mix shifted toward higher-volume configurations.
The direction of travel matters as much as the current level. Palantir’s margins are still expanding with room to run. NVIDIA’s are already exceptional and more likely to face incremental pressure as competition intensifies and the supply-demand imbalance in AI chips gradually normalizes.
See what analysts think about PLTR stock right now (Free with TIKR) >>>
What the Consensus and the Models Say About Five-Year Returns
Analyst coverage tells an important story about conviction. Fifty-one analysts contribute to NVIDIA’s 2026 estimates and 53 cover 2027, reflecting near-term visibility that is unusual for a company this size. Palantir’s 2026 estimates involve 28 contributors, which drops to 13 by 2028, signaling that the long-term commercial growth trajectory carries meaningful uncertainty.
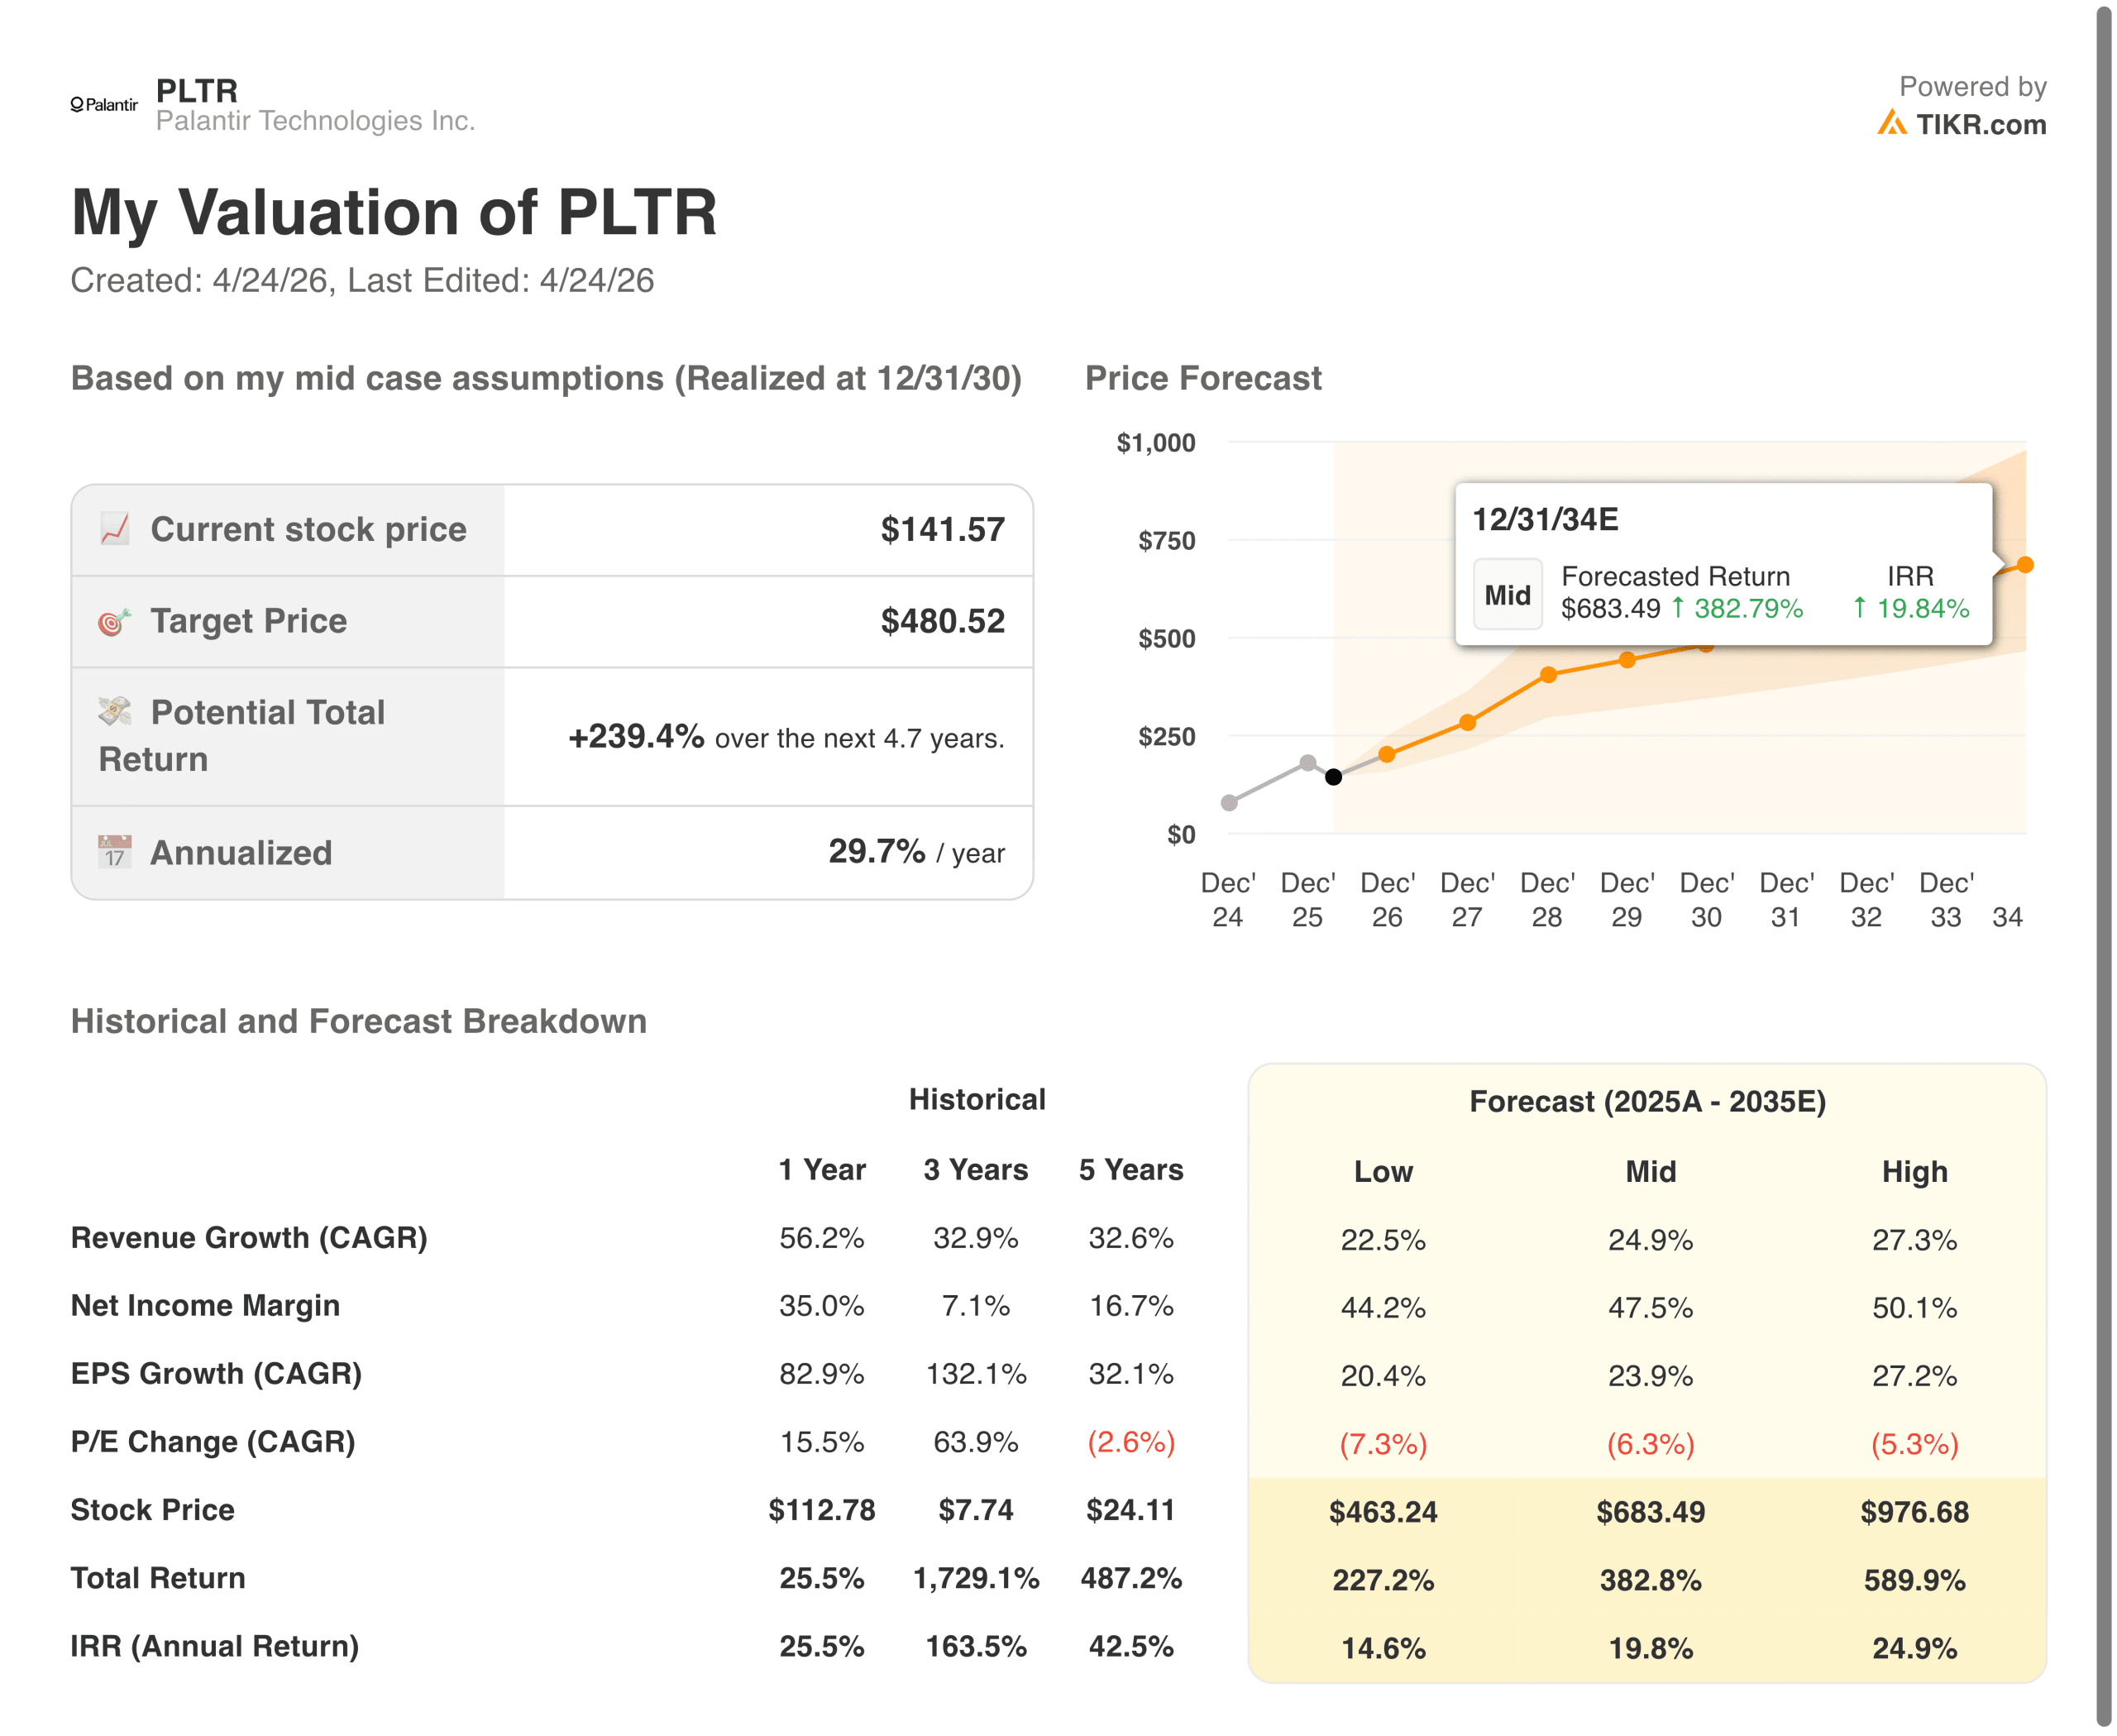
On the model side, Palantir’s mid-case targets approximately $480 by December 2030, implying roughly 239% total upside and 30% annualized returns. That requires roughly 25% annual revenue growth through 2035 with net income margins expanding toward 47.5%.
NVIDIA’s mid-case targets approximately $500 by January 2031, implying roughly 151% upside and 21% annualized returns, with revenue growing at roughly 20% annually and net income margins stabilizing around 56%.

The 9-percentage-point IRR gap in Palantir’s favor is real, but so is the execution risk embedded in it. Sustaining 25% revenue growth for a decade while simultaneously expanding margins to 47% is a high bar, even for a business with Palantir’s switching costs and government relationships.
See analysts’ full growth forecasts and estimates for NVDA stock (It’s free) >>>
Which One Is the Better Bet at Current Prices
At 107x forward earnings, Palantir needs its government contract durability, software margin expansion, and commercial AIP adoption to all materialize on schedule. Any one of those legs wobbling creates meaningful downside from a multiple that offers little cushion.
At 24x forward earnings, NVIDIA is priced for solid, not perfect, execution. The hardware cycle will eventually moderate, competition will intensify, and hyperscaler capital spending will normalize. But 24x for a business with 60% operating margins, 70% near-term revenue growth, and a near-monopoly on AI compute is a very different risk-reward than the alternative.
If the next five years look like the last two, Palantir’s model suggests a higher IRR. If the AI infrastructure spending cycle moderates faster than expected, NVIDIA’s margin profile and lower multiple provide a more forgiving landing. The choice ultimately comes down to how much execution risk an investor is willing to accept for roughly 9 additional points of annualized return.
Build your own Valuation Model to value any stock (It’s free!) >>>
How Much Upside Does Each Stock Have From Here?
With TIKR’s new Valuation Model tool, you can estimate a stock’s potential share price in under a minute.
All it takes is three simple inputs:
- Revenue Growth
- Operating Margins
- Exit P/E Multiple
If you’re not sure what to enter, TIKR automatically fills in each input using analysts’ consensus estimates, giving you a quick, reliable starting point.
From there, TIKR calculates the potential share price and total returns under Bull, Base, and Bear scenarios so you can quickly see whether a stock looks undervalued or overvalued.
See a stock’s true value in under 60 seconds (Free with TIKR) >>>
Looking for New Opportunities?
- See what stocks billionaire investors are buying so you can follow the smart money.
- Analyze stocks in as little as 5 minutes with TIKR’s all-in-one, easy-to-use platform.
- The more rocks you overturn… the more opportunities you’ll uncover. Search 100K+ global stocks, global top investor holdings, and more with TIKR.
Disclaimer:
Please note that the articles on TIKR are not intended to serve as investment or financial advice from TIKR or our content team, nor are they recommendations to buy or sell any stocks. We create our content based on TIKR Terminal’s investment data and analysts’ estimates. Our analysis might not include recent company news or important updates. TIKR has no position in any stocks mentioned. Thank you for reading, and happy investing!