

Key Stats: Halliburton (HAL) — Q1 2026
- Current price: ~$40
- Q1 2026 revenue: $5.4B, flat YoY (0.3% decline)
- Q1 2026 EPS (reported/adjusted): $0.55, down ~8% YoY
- International revenue: $3.3B, up 3% YoY
- North America revenue: $2.1B, down 4% YoY
- Completion & Production revenue: $3B, down 3% YoY; operating margin: 15%
- Drilling & Evaluation revenue: $2.4B, up 4% YoY; operating margin: 15%
- Middle East conflict EPS impact: $0.02–$0.03 in Q1; estimated $0.07–$0.09 in Q2
- Q2 guidance: C&P revenue up 4%–6% sequentially, margins up 50–100 bps; D&E flat to down 2%, margins down 75–125 bps
- Full-year 2026 CapEx: ~$1.1B
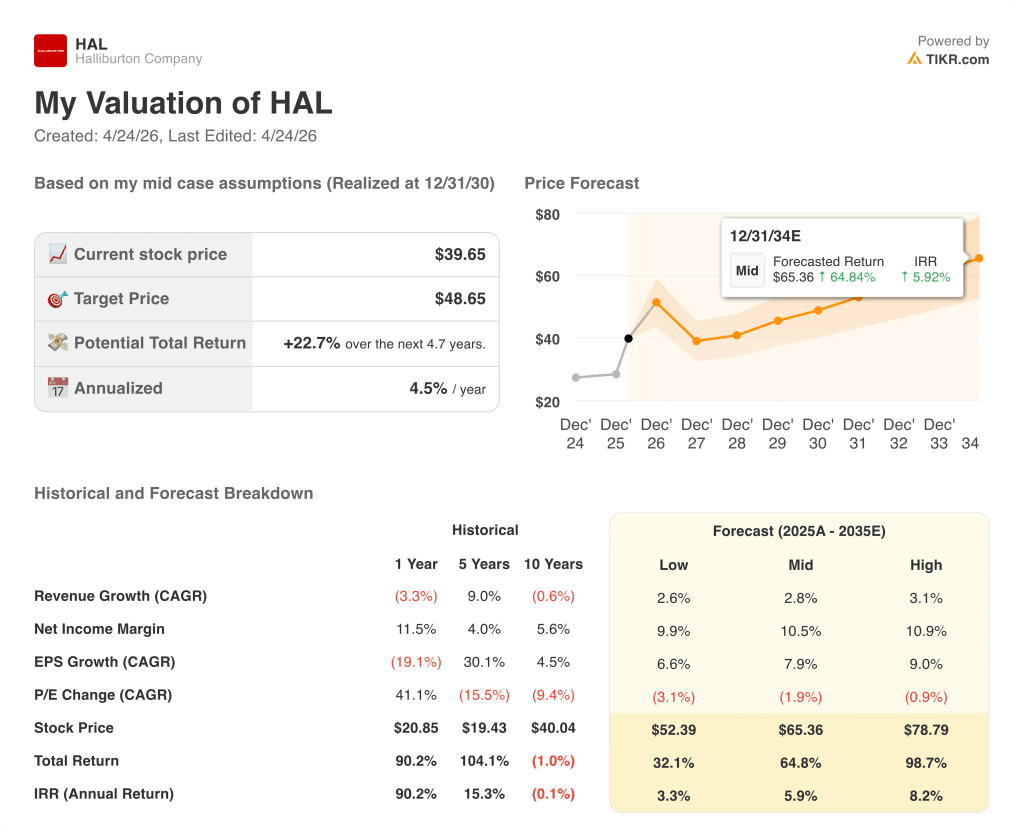
- TIKR model price target: ~$49; implied upside: ~23% over ~5 years
Halliburton Stock Q1 2026 Earnings Breakdown

Halliburton stock (HAL) held its revenue line in Q1 2026, delivering $5.4B in total company revenue, essentially flat year-over-year, while absorbing a direct hit from the Middle East conflict that clipped EPS by $0.02 to $0.03 in March alone.
EPS came in at $0.55, down from $0.60 in Q1 2025, with the conflict-related drag concentrated in the final weeks of the quarter.
The international segment was the relative bright spot, with Latin America posting 22% revenue growth year-over-year to $1.1B, driven by higher activity across Ecuador, Brazil, the Caribbean, Mexico, and Argentina.
The most concrete growth signal internationally was Halliburton’s multibillion-dollar integrated completions award with YPF in Argentina, which will mark the first international deployment of the ZEUS electric fracturing platform outside of North America, according to Shannon Slocum, Executive Vice President and COO, on the Q1 earnings call.
Europe-Africa revenue rose 11% year-over-year to $858M, led by drilling services in Norway and improved pressure pumping in Angola.
Middle East/Asia revenue fell 13% year-over-year to $1.3B, entirely conflict-driven, with offshore markets in Qatar, UAE, and Saudi Arabia and land markets in Iraq and Kuwait most affected.
North America revenue declined 4% year-over-year to $2.1B, with lower stimulation activity and decreased artificial lift in U.S. land weighing on the Completion and Production division.
Management’s recovery thesis for North America rested on two specific signals: frac calendar white space for H1 2026 has been eliminated, and inbound calls for spot work from smaller operators have picked up, pointing to early-stage capacity tightening in premium and dual-fuel frac equipment.
For Q2, Halliburton guided C&P revenue to grow 4% to 6% sequentially with 50 to 100 basis points of margin improvement, while D&E is expected to be flat to down 2% due to seasonal software roll-off, with margins contracting 75 to 125 basis points.
The Q2 Middle East impact is estimated at $0.07 to $0.09 per share, embedded in divisional guidance, with the company assuming disruption levels similar to late Q1 and a partial restart of offshore work midway through the quarter.
Halliburton repurchased $100M of common stock in Q1, with CFO Eric Carre on the Q1 earnings call stating Q2 buybacks will be higher than Q1 and H2 buybacks higher than H1.
Halliburton Stock Financials: Margin Compression Under Conflict Pressure
Halliburton stock has been in a clear margin compression cycle since mid-2024, and Q1 2026 shows no sign of a floor yet.

Revenue peaked at $5.8B in Q2 2024 and has declined in five of the six quarters since, landing at $5.4B in Q1 2026.
Gross margin followed the same arc: 19% in Q2 2024, 16% in Q1 2025, 15% in Q1 2026.
Operating margin peaked at 18% in Q2 2024, held at 13% through Q1 2025, and sits at 12.6% today, a compression of roughly 510 basis points from peak to current.
Operating income tells the same story: $1.0B in Q2 2024, $695M in Q1 2025, $679M in Q1 2026.
On the Q1 earnings call, CFO Eric Carre attributed the current-quarter drag to two buckets: lost revenue from Middle East disruptions and elevated logistics, fuel, and supply chain costs, with the combined impact estimated at $0.02 to $0.03 per share in Q1 alone.
Q2 guidance embeds a $0.07 to $0.09 per share Middle East impact, suggesting the cost pressure that has driven margin compression since Q2 2024 is intensifying before it eases.
Halliburton Stock Valuation Model Take
The TIKR model prices Halliburton stock at ~$49 under mid-case assumptions, implying roughly 23% total upside from the current ~$40 price over approximately 4.7 years, or about 4.5% annualized.
The mid-case assumes a revenue CAGR of 2.8% through 2035 and a net income margin of ~10.5%, modest targets for a company that has historically run higher margins during upcycles.
This earnings report does not materially change the valuation math, but it clarifies the shape of the risk: the upside is not in the model assumptions, it is in whether the macro setup Jeff Miller described on the Q1 call, structurally tighter oil markets, energy security becoming an investment driver, and North America capacity tightening, actually translates into pricing power and volume recovery over the next 12 to 18 months.
At roughly $40, Halliburton stock is priced for a subdued cycle, making the investment case more compelling if the recovery narrative holds, and less forgiving if Middle East disruptions persist or North America demand signals reverse.
The real question Halliburton stock poses after Q1: Can the company restore margins while absorbing a prolonged Middle East disruption, or is the recovery thesis entirely dependent on a conflict resolution that has no clear timeline?
What Has to Go Right
- Latin America sustains mid-to-high single-digit international growth ex-Middle East, with the YPF multibillion-dollar ZEUS deployment in Argentina ramping through 2026 and into 2027
- North America frac capacity tightening progresses from white space elimination and spot inbounds to committed fleet additions and pricing restoration on existing fleets
- Middle East offshore partially restarts in Q2 as modeled, with $0.07 to $0.09 EPS impact representing the peak drag rather than a floor
- ZEUS IQ and iCruise adoption continue to differentiate Halliburton in technology-driven contract wins, supporting margin recovery in C&P above the Q1 15% level
What Could Still Go Wrong
- Middle East restart is delayed beyond the Q2 midpoint assumption, triggering the additional $0.03 to $0.05 EPS downside Eric Carre flagged on the call
- North America recovery stalls if large public E&Ps, which Jeff Miller acknowledged typically lag smaller operators, hold CapEx budgets flat through H2 2026
- Operating margin remains compressed near 12% to 13% even as revenue stabilizes, with elevated logistics, fuel, and supply chain costs in the Middle East offsetting international growth
- The TIKR model’s 2.8% revenue CAGR assumption proves optimistic if oil demand growth softens or OPEC+ supply policy shifts before the North America recovery gains critical mass
Should You Invest in Halliburton Company?
The only way to really know is to look at the numbers yourself. TIKR gives you free access to the same institutional-quality financial data that professional analysts use to answer exactly that question.
Pull up HAL stock and you’ll see years of historical financials, what Wall Street analysts expect for revenue and earnings in the quarters ahead, how valuation multiples have moved over time, and whether price targets are trending up or down.
You can build a free watchlist to track Halliburton Company alongside every other stock on your radar. No credit card required. Just the data you need to decide for yourself.
Access Professional Tools to Analyze HAL stock on TIKR for Free →


