Key Stats for Fidelity National Information Services Stock
- 52-Week Range: $43 to $83
- Current Price: $48
- Street Mean Target: $65
- Street High Target: $85
- TIKR Model Target (Dec. 2030): $69
What Happened?
Fidelity National Information Services (FIS), the Jacksonville-based technology provider powering core banking, payments, and capital markets processing for the world’s largest financial institutions, is trading near a 52-week low of $43 even as its banking business delivers its second consecutive year of above-guidance organic growth.
The defining event was the January 9 close of FIS’s acquisition of Total Issuing Solutions, formerly TSYS (the credit card processing unit Global Payments agreed to sell in 2024), funded by roughly $7.7 billion in net cash and refinanced through $7.8 billion in senior notes issued in March.
That deal, which also involved the simultaneous sale of FIS’s remaining 45% Worldpay stake, transforms Fidelity National Information Services stock into a pure-play financial services technology play now processing over 1 billion accounts and roughly 73 billion transactions annually across core banking, debit, credit, payments, and capital markets.
The financial cost of that transformation is visible: FIS suspended share repurchases and paused tuck-in M&A to prioritize debt repayment, and Q4 adjusted EPS of $1.68 narrowly missed the $1.69 consensus estimate, while Q4 adjusted EBITDA of $1.20 billion came in below the $1.21 billion estimate.
CEO Stephanie Ferris stated on the Q4 2025 earnings call that “we are positioning our business to double our cash flow in 3 years to over $3 billion,” grounding that target in TSYS’s high-margin free cash flow profile, $125 million in identified cost synergies, and accelerating recurring annual contract value (ACV) growth across banking and capital markets.
That path runs through a banking segment guiding 5% to 5.5% pro forma revenue growth in 2026, capital markets at 5.5% to 6.5%, and a combined free cash flow target exceeding $2 billion this year, growing at roughly three times the rate of adjusted EPS.
Wall Street’s Take on FIS Stock
The TSYS close transforms FIS’s free cash flow identity, lifting 2026 guidance to $2 billion-plus and putting the company on a credible path to $3 billion by 2028, a trajectory that the current price of Fidelity National Information Services stock does not reflect.
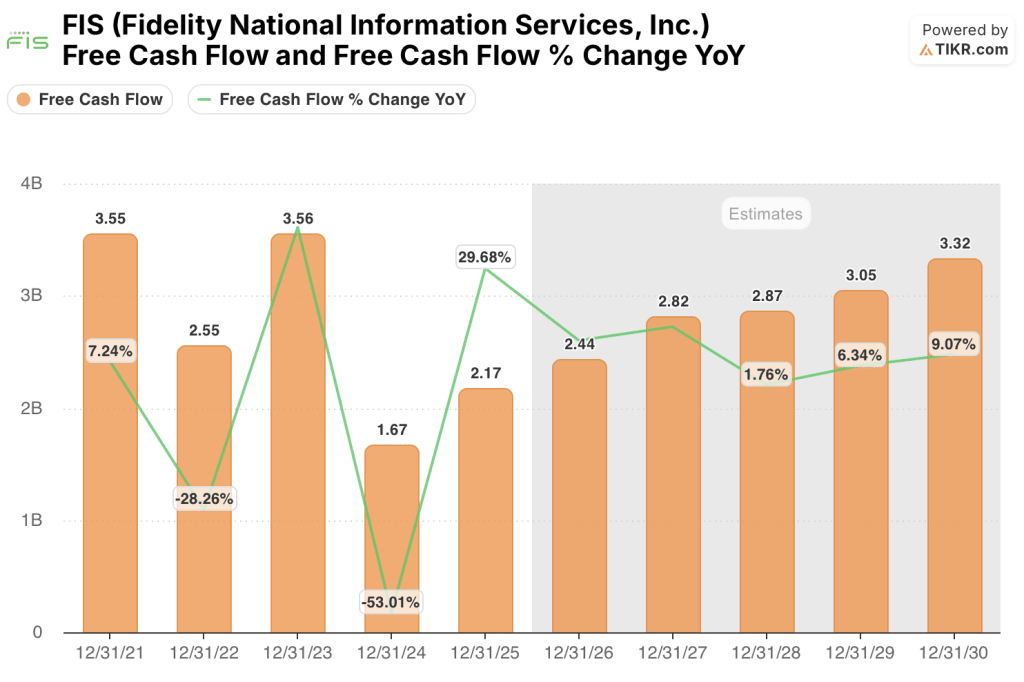
FIS’s free cash flow grew about 30% in 2025 to $2.17 billion, and consensus estimates project roughly $2.44 billion in 2026 (around 12% growth) as elevated integration costs hold back the full potential, with acceleration to roughly $2.82 billion in 2027 as those costs roll off.

Sixteen analysts carry buy or outperform ratings on FIS stock versus nine holds and one underperform, with a mean price target of $65 implying roughly 43% upside from current levels as the Street waits for integration execution evidence and the first clean free cash flow print post-TSYS.
The bull target of $85 anchors to full synergy realization and buyback resumption by 2028, while the bear target of $40 assumes integration drag persists longer than guided and debt servicing absorbs more cash than outlined; the spread tells you this is a story about execution, not business quality.
Priced at roughly 10x 2026 consensus free cash flow against a business guiding to around 25% compound annual FCF growth through 2028, Fidelity National Information Services stock appears undervalued relative to both its own historical FCF multiples and the trajectory the TSYS deal enables.
Debt servicing on $7.8 billion in newly issued senior notes is the risk: any slippage in TSYS synergy timing or a slowdown in banking recurring revenue growth could delay the FCF inflection by 12 to 18 months.
Q1 2026 results on May 8 are the first clean look at the combined company, with pro forma EBITDA margin expansion of 35 to 55 basis points the specific number to watch alongside the recurring ACV growth rate in banking.
What Does the Valuation Model Say?
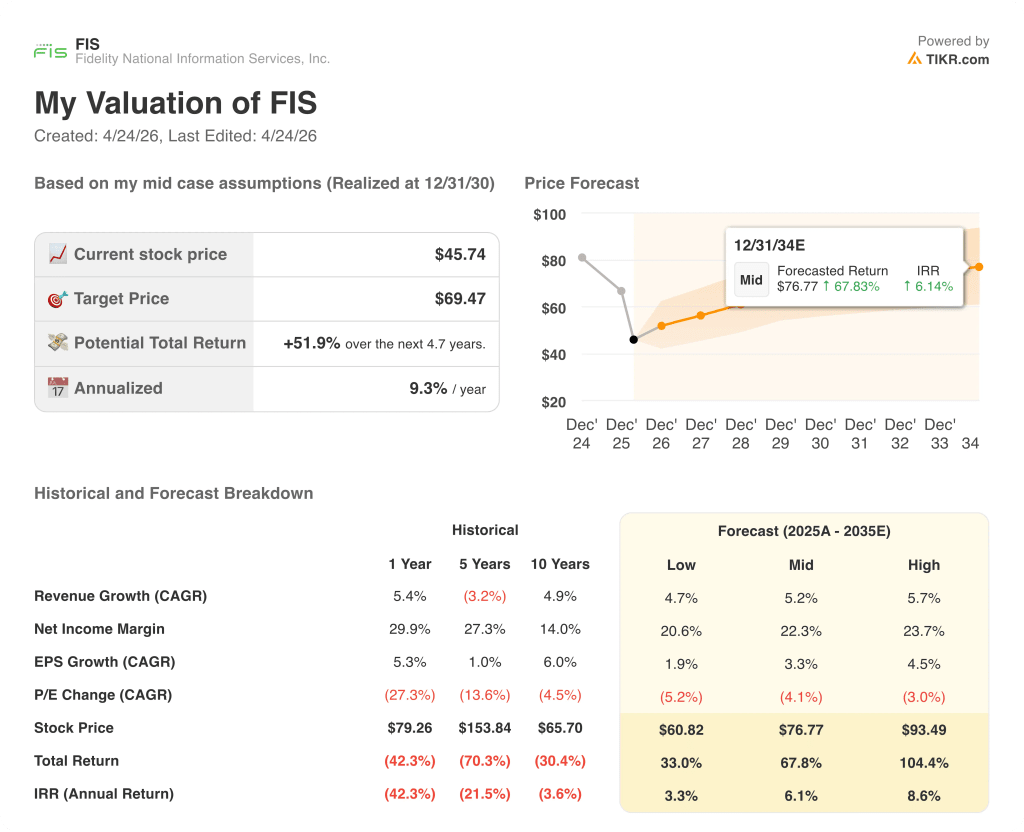
TIKR’s mid-case model targets FIS at around $77, implying roughly 52% total return over the next ~5 years at an annualized rate of around 6%, driven by roughly 5% revenue CAGR and net income margins expanding to around 22% as integration costs roll off and TSYS synergies flow through the income statement.
With FIS trading at roughly 10x 2026 free cash flow on a business that has guided explicitly to $3 billion in annual FCF by 2028, and with 16 of 26 covering analysts rating it a buy against a stock that sits 44% below its 52-week high, FIS stock is undervalued at a discount that prices in execution risk but not the compounding cash engine the combined platform represents.
The investment case hinges on one question: whether FIS executes the TSYS integration on the timeline it has explicitly committed to.
Bull Case
- Free cash flow reaches $3 billion by 2028 as $250 million in annual TSYS integration costs roll off and the Prime international credit processing platform (around $200 million in revenue, 15% CAGR) scales with the newly added international sales force
- Banking pro forma organic growth sustains above 4.7% as bank M&A activity drives platform consolidation wins, with the company capturing Synovus and Pinnacle already in 2025 and the pipeline of $10 billion-plus bank deals expanding
- Capital markets recurring revenue accelerates to mid-to-high single digits as the deliberate shift away from nonrecurring license sales cements a higher-margin, more predictable revenue base (71% recurring in 2025, growing)
- Buyback resumption in 2028, funded by $3 billion-plus in free cash flow, delivers EPS accretion on top of the organic earnings growth trajectory
Bear Case
- $800 million in 2026 transformation and integration costs persist above $600 million in 2027, compressing the FCF bridge and delaying the $3 billion target by 12 to 18 months
- TSYS revenue synergies of $45 million (2028 target) slip as large bank credit card contract negotiations take longer than guided; no large renewals are pending in 2026, but the pipeline restarts in 2027
- Capital markets nonrecurring revenue declines faster than recurring growth can offset as the shift away from license sales creates a 1-to-2-year revenue gap that pressures the segment guide of 5.5% to 6.5%
- Debt servicing on $7.8 billion in senior notes (coupons ranging from 4.45% to 4.80%) absorbs more free cash flow than modeled if segment revenue growth comes in at the low end of guidance
Should You Invest in Fidelity National Information Services, Inc.?
The only way to really know is to look at the numbers yourself. TIKR gives you free access to the same institutional-quality financial data that professional analysts use to answer exactly that question.
Pull up FIS stock and you’ll see years of historical financials, what Wall Street analysts expect for revenue and earnings in the quarters ahead, how valuation multiples have moved over time, and whether price targets are trending up or down.
You can build a free watchlist to track Fidelity National Information Services, Inc. alongside every other stock on your radar. No credit card required. Just the data you need to decide for yourself.
Access Professional Tools to Analyze FIS stock on TIKR for Free →