

Key Takeaways:
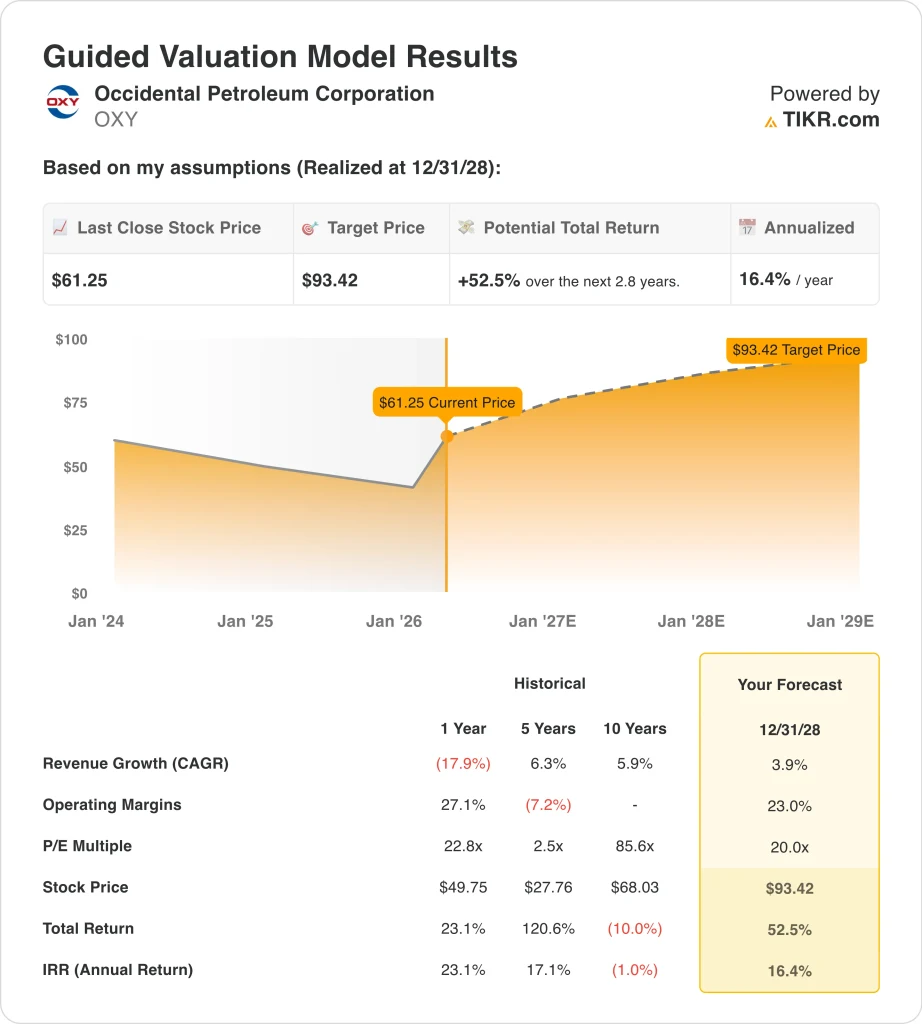
- Occidental Petroleum stock could reasonably reach $93 per share by December 2028, based on our valuation assumptions.
- This implies a total return of 52.5% from today’s $61 price, with an annualized return of 16.4% over the next 2.8 years.
- OXY’s stock is moving with crude prices, while debt reduction, capital spending, and production trends remain key valuation drivers.
What Happened?
Occidental Petroleum (OXY) has become a direct read-through on oil prices again, and that helps explain why the stock has rallied sharply in 2026. Reuters reported that energy shares climbed as crude rose on fears of prolonged conflict involving Iran, and OXY also appeared in Reuters market roundups as traders reacted to those oil moves. That matters because Occidental’s earnings are still highly sensitive to realized oil and gas prices, even after years of debt reduction and portfolio reshaping.
The company also entered 2026 with a cleaner balance sheet after closing the OxyChem sale on January 2. Occidental said that the transaction reduced debt by $5.8 billion since mid-December 2025 and brought principal debt to date to $15.0 billion. At the same time, management raised the quarterly dividend by more than 8% to $0.26 per share, signaling confidence in free cash flow following the asset sale.
Fourth-quarter results showed both the upside and the limits of the current setup. Occidental reported adjusted income attributable to common stockholders of $315 million, or $0.31 per diluted share, while total company production averaged 1,481 Mboed and exceeded the high end of guidance. However, the SEC-filed earnings release also said pre-tax oil and gas income fell quarter over quarter because realized commodity prices declined across all products.
That mix is why the stock keeps trading on macro headlines as much as company execution. Reuters reported that Brent crude briefly moved above $119 on March 19 before easing, and then oil dropped more than 5% on March 25 on ceasefire hopes. So OXY’s recent price action reflects both stronger near-term commodity pricing and the market’s understanding that those gains can reverse quickly if the oil shock fades.
What the Model Says for Occidental Petroleum
We analyzed the upside potential for Occidental stock using valuation assumptions based on its oil-linked earnings power, improved balance sheet, and still-strong operating margins.
Based on estimates of 3.9% annual revenue growth, 23.0% operating margins, and a 20.0x P/E multiple, the model projects OXY stock could rise from $61 to $93 per share.
That would represent a 52.5% total return, or 16.4% annualized returns over the next 2.8 years.
Our Valuation Assumptions
TIKR’s Valuation Model lets you plug in your own assumptions for a company’s revenue growth, operating margins, and P/E multiple, and calculates the stock’s expected returns.
Here’s what we used for OXY stock:
1. Revenue Growth: 3.9%
Occidental’s revenue base has reset lower since the 2022 commodity peak, which is why the growth assumption stays modest. Revenue was $36.6 billion in 2022, then fell to $23.2 billion in 2023, $22.0 billion in 2024, and $21.6 billion in 2025. That pattern shows the business is now competing against a much lower starting point, but it also shows how exposed top-line results remain to commodity prices.
The latest official results support a cautious growth assumption rather than an aggressive one. Occidental said fourth-quarter 2025 oil and gas pre-tax income fell because realized prices declined across crude, NGLs, and domestic gas, even as production beat guidance. Still, the company ended 2025 with 4.6 billion BOE of proved reserves, a 98% all-in reserves replacement ratio, and a 107% organic reserves replacement ratio, which supports the durability of its asset base.
A 3.9% revenue CAGR through 2028, therefore, looks tied to steady production and a more supportive commodity backdrop, not to a major volume boom. Reuters also reported that the WTI-Brent spread widened sharply in March, which can support U.S. export economics even as global supply risks keep crude volatile. For the business, that means growth still depends more on oil prices and realized differentials than on pure production expansion.
2. Operating Margins: 23%
Occidental’s operating margin is already strong by most industries’ standards, but it has moved down from cycle highs. Operating margin was 37.3% in 2022, 19.7% in 2023, 19.8% in 2024, and 17.2% in 2025. So the model’s 23.0% margin assumption implies improvement from current levels, but it still stays well below the 2022 peak.
Management’s latest commentary helps explain why a recovery is plausible. Vicki Hollub said, “Our emphasis on operational excellence and cost efficiency drove meaningful production and operating expense outperformance during the fourth quarter,” and she added that the company remains focused on resilient free cash flow and capital flexibility after the OxyChem sale. That matters because better costs and less balance-sheet pressure can help offset some commodity swings, even if they cannot remove them.
Still, the margin story is not just about efficiency. Reuters reported that Occidental expects 2026 capital spending to range between $6.3 billion and $6.7 billion, while management also said U.S. onshore spending is expected to decrease by $400 million relative to 2025. For the business, that means margin performance will reflect both cost control and portfolio mix, especially if higher-return barrels and midstream optimization offset lower chemical earnings after the OxyChem divestiture.
3. Exit P/E Multiple: 20x
The exit multiple is the most important swing factor in this model because OXY’s historical P/E has been extremely distorted by commodity cycles. In the guided valuation image you attached, the current framework uses a 20.0x P/E multiple by 12/31/28. That compares with a 1-year historical P/E of 22.8x, a 5-year figure of 2.5x, and a 10-year figure of 85.6x in the same model, which shows how noisy backward-looking P/E comparisons can be for energy producers.
That also fits the current debate around the stock. Raymond James raised its price target on Occidental to $64 from $50 on March 19, according to Reuters, while the broader Street mean target still sits below the current share price. So the valuation case depends less on a dramatic rerating and more on whether oil prices, margins, and deleveraging keep supporting earnings power.
Build your own Valuation Model to value any stock (It’s free!) >>>
What Happens If Things Go Better or Worse?
Different scenarios for OXY stock through 2030 show varied outcomes based on oil prices, production trends, and valuation multiples (these are estimates, not guaranteed returns):
- Low Case: Lower oil prices and weaker margins lead to a $52 stock price → -3.2% annual returns
- Mid Case: Steady production, solid margins, and a higher valuation multiple drive a $107 stock price → 12.4% annual returns
- High Case: Better operating results but a lower exit multiple result in a $80 stock price → 5.7% annual returns

That framing fits how energy stocks often behave. Oil prices can lift earnings quickly, but stocks can still underperform if investors think the commodity spike is temporary or if they expect lower future multiples. So OXY’s valuation range is not just about production and margins, but also about how durable the market believes current crude prices really are.
Occidental also has several near-term events that could affect how investors update those scenarios. The company is scheduled to present at EarthX on April 20, hold its annual meeting and shareholder call on May 1, and report Q1 2026 results on May 7, according to its investor materials and the event list you provided. Those events should matter because investors will be watching capital spending, debt, and realized prices more closely than headline production alone.
See what analysts think about OXY stock right now (Free with TIKR) >>>
Should You Invest in Occidental Petroleum Corporation?
The only way to really know is to look at the numbers yourself. TIKR gives you free access to the same institutional-quality financial data that professional analysts use to answer exactly that question.
Pull up OXY, and you’ll see years of historical financials, what Wall Street analysts expect for revenue and earnings in the quarters ahead, how valuation multiples have moved over time, and whether price targets are trending up or down.
You can build a free watchlist to track OXY alongside every other stock on your radar. No credit card required. Just the data you need to decide for yourself.
Analyze Occidental Petroleum stock on TIKR Free→
Looking for New Opportunities?
- See what stock billionaire investors are buying so you can follow the smart money.
- Analyze stocks in as little as 5 minutes with TIKR’s all-in-one, easy-to-use platform.
- The more rocks you overturn… the more opportunities you’ll uncover. Search 100K+ global stocks, global top investor holdings, and more with TIKR.
Disclaimer:
Please note that the articles on TIKR are not intended to serve as investment or financial advice from TIKR or our content team, nor are they recommendations to buy or sell any stocks. We create our content based on TIKR Terminal’s investment data and analysts’ estimates. Our analysis might not include recent company news or important updates. TIKR has no position in any stocks mentioned. Thank you for reading, and happy investing!


