Key Stats for Intuitive Surgical Stock
- Pre-Market Price change for Intuitive Surgical stock: -11%
- $ISRG Stock Price as of Jul. 16: $402
- 52-Week High: $604
- $ISRG Stock Price Target: $550
Now Live: Discover how much upside your favorite stocks could have using TIKR’s new Valuation Model (It’s free)>>>
What Happened?
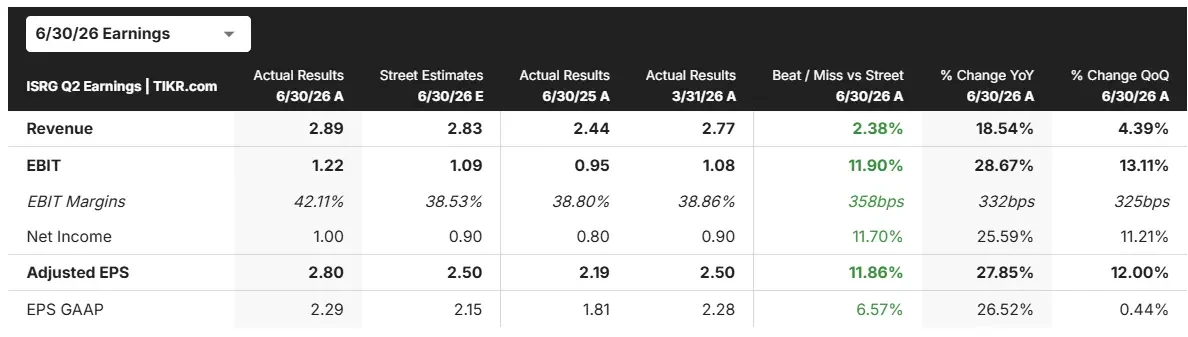
Intuitive Surgical (ISRG) stock closed up over 3% on Thursday, then dropped more than 10% after hours, even though the quarter itself looked strong.
Revenue came in at $2.89 billion, up 19% from $2.44 billion a year ago. Non-GAAP earnings hit $2.80 per share, up from $2.19 in the same quarter last year. GAAP net income rose to $818 million, or $2.29 per share, compared to $658 million a year ago.
So why did Intuitive Surgical stock fall so sharply after such a solid report? A big part of the story is procedure growth trends in the U.S. slowing down more than expected.
Total procedures grew 16% globally, driven by 15% growth in da Vinci procedures and 36% growth in Ion procedures. But in the U.S. specifically, growth in da Vinci procedures came in at 12%, down from 14% in the first quarter.
Management pointed to patients delaying care due to changes in ACA premium subsidies as one factor behind the slowdown, along with some natural moderation as the business grows.
On the positive side, system placements looked healthy.
- Intuitive placed 468 da Vinci systems during the quarter, up from 395 a year ago, including 246 da Vinci 5 systems with 114 dual consoles.
- The da Vinci installed base grew 12% to nearly 11,710 systems, while the newer Ion platform’s installed base grew 21% to 1,096 systems.
- The company also placed 55 Ion systems and 38 da Vinci SP systems during the quarter, with SP procedures growing 61% year-over-year.
Profitability also improved. Non-GAAP gross margin rose to 70%, up from 67.9% a year ago, partly helped by a one-time $36 million tariff refund benefit.
Intuitive ended the quarter with $8.6 billion in cash and investments, up from $8 billion, and repurchased $379 million in shares.
Looking ahead, Intuitive kept its full-year 2026 outlook mostly intact.
The company still expects da Vinci procedure growth between 13.5% and 15.5%, though it now expects results closer to the midpoint of that range rather than the higher end.
Non-GAAP gross margin guidance was actually raised slightly, to a range of 68% to 69%, up from the prior 67.5% to 68.5%.
See analysts’ growth forecasts and price targets for Intuitive Surgical stock (It’s free) >>>
What the Market Is Telling Us About Intuitive Surgical Stock
The sharp after-hours drop in Intuitive Surgical stock suggests investors are more focused on the deceleration in U.S. procedure growth than on the headline earnings beat.
When a high-growth medical device company shows signs of slowing demand, even a strong quarter can trigger a sell-off if investors think the trend will continue.
Management was clear that the underlying disease burden hasn’t changed, meaning deferred procedures are expected to eventually happen.
Whether that reassurance holds up will likely shape how Intuitive Surgical stock trades in the coming quarters, especially as investors watch for any further impact from ACA subsidy changes and continued competition in markets like China.
Estimate a company’s fair value instantly (Free with TIKR) >>>
How Much Upside Does Intuitive Surgical Stock Have From Here?
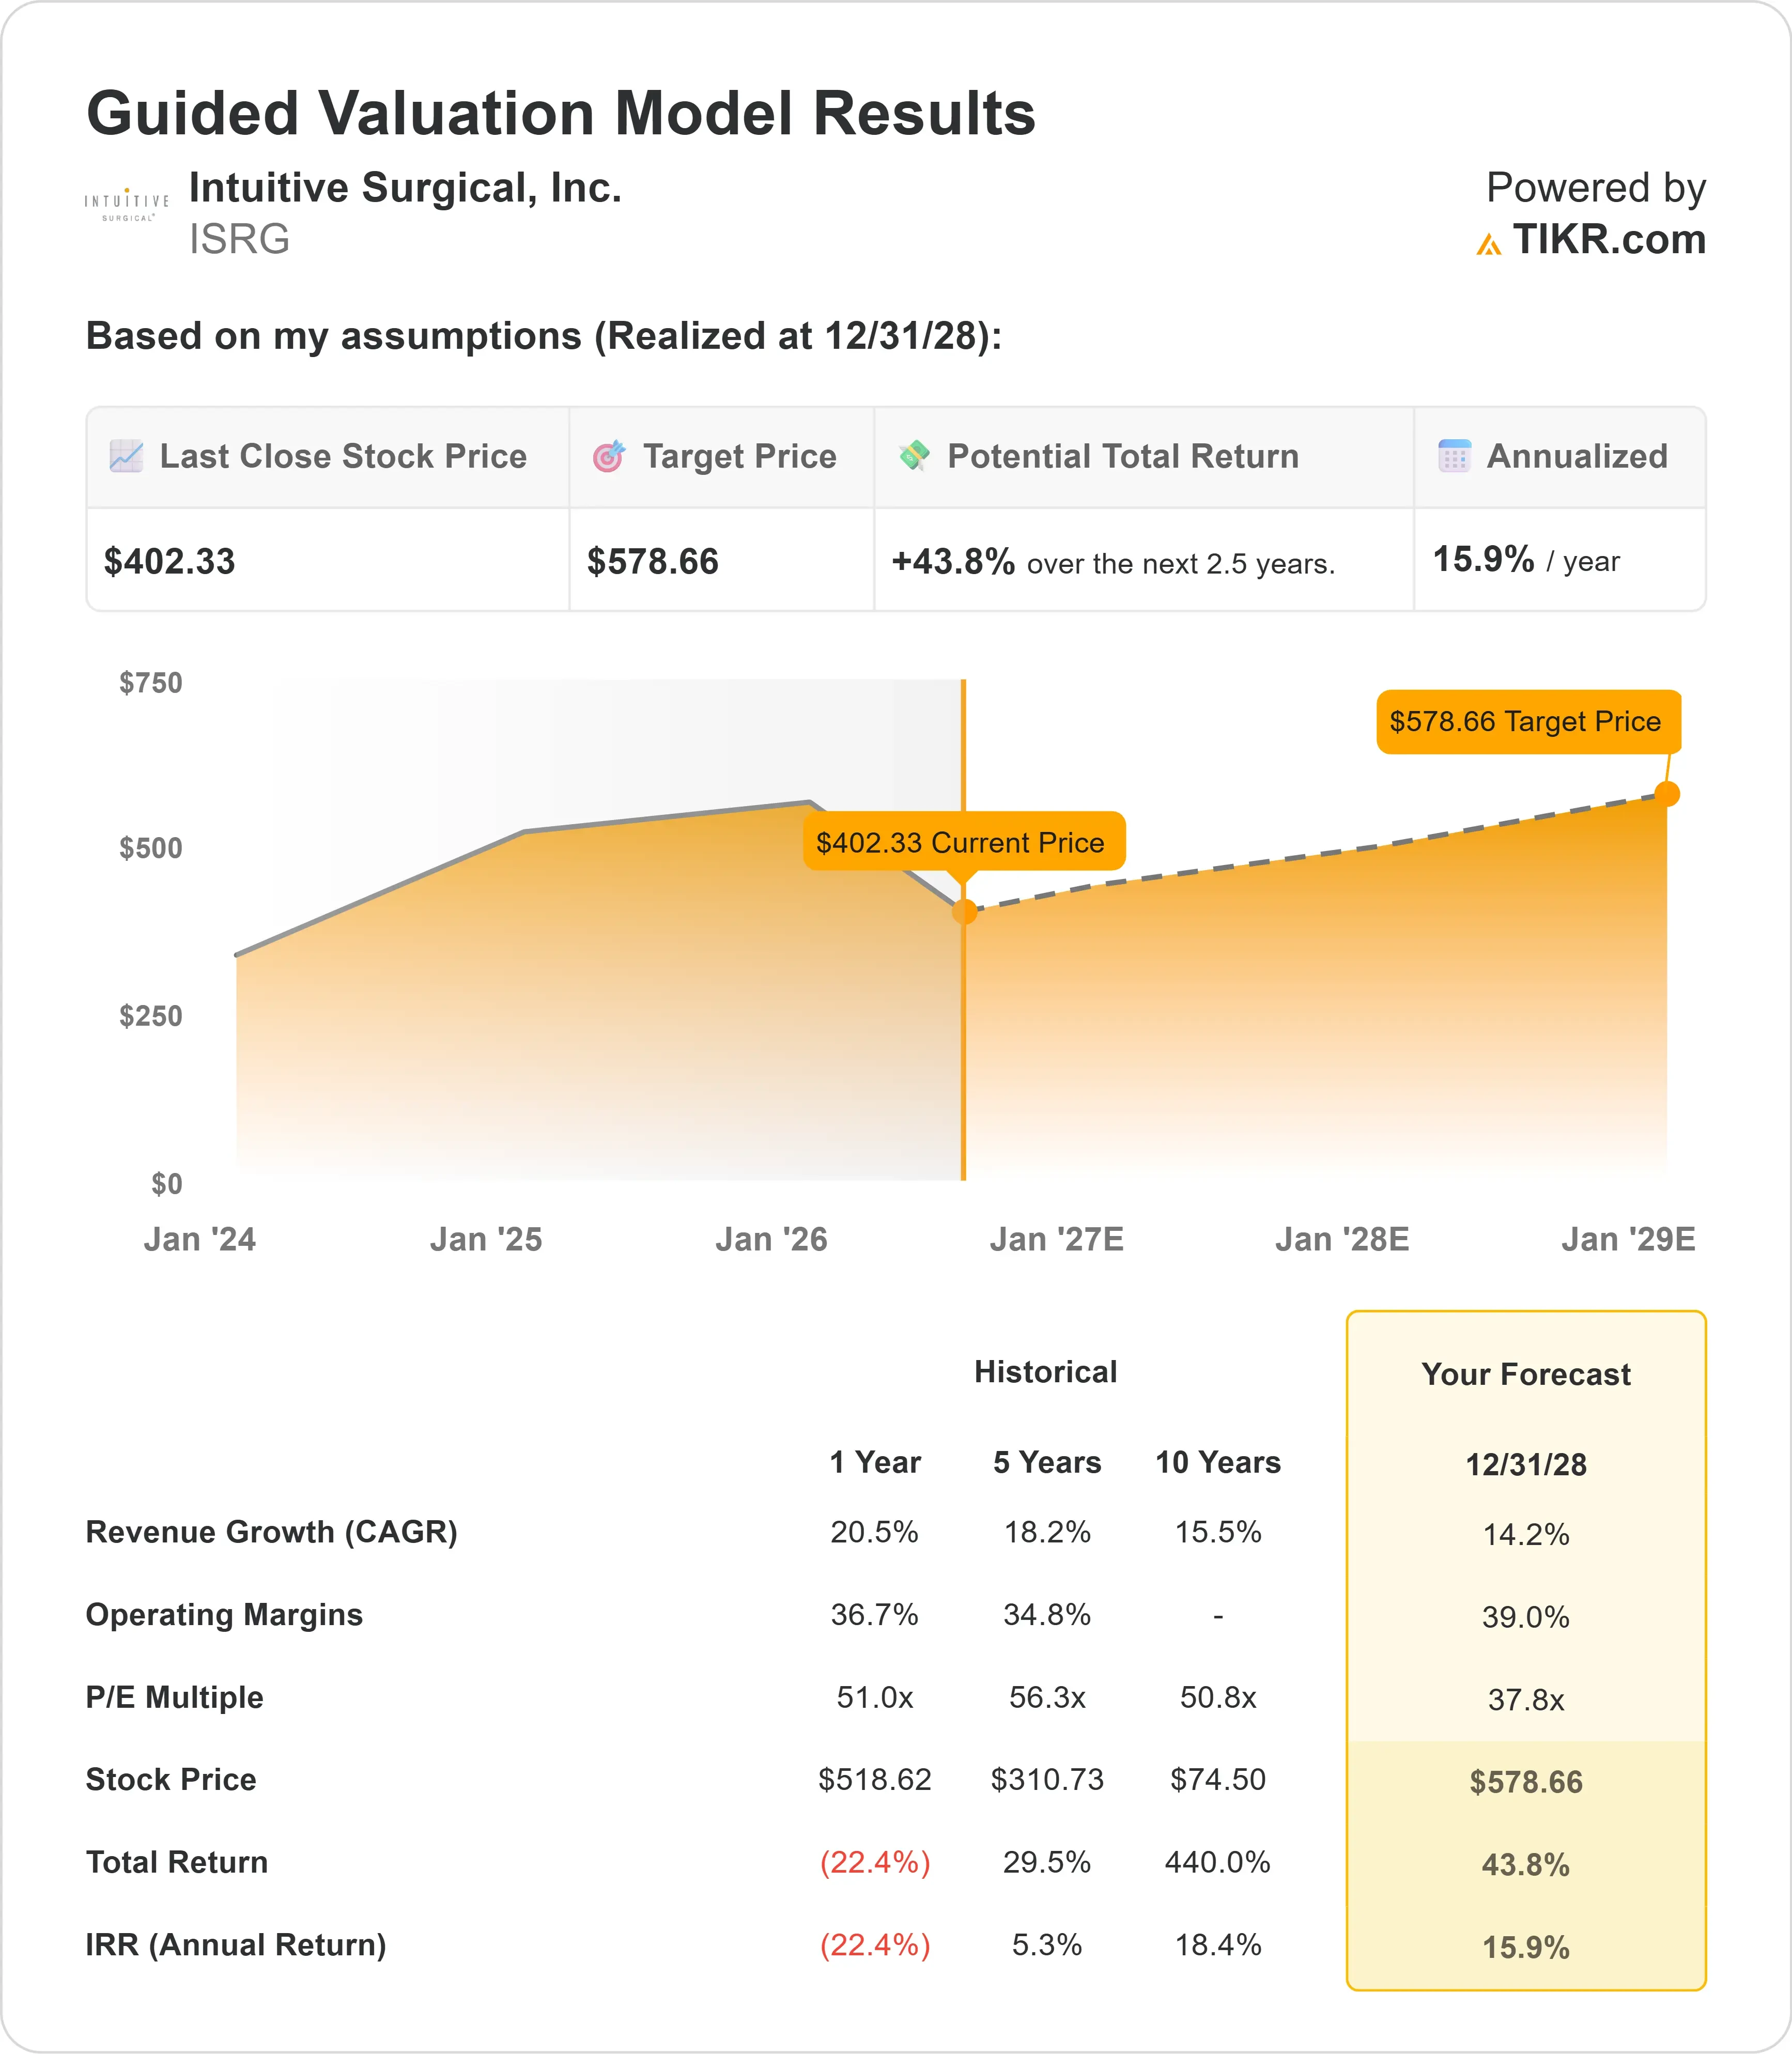
With TIKR’s new Valuation Model tool, you can estimate a stock’s potential share price in under a minute.
All it takes is three simple inputs:
- Revenue Growth
- Operating Margins
- Exit P/E Multiple
If you’re not sure what to enter, TIKR automatically fills in each input using analysts’ consensus estimates, giving you a quick, reliable starting point.
From there, TIKR calculates the potential share price and total returns under Bull, Base, and Bear scenarios so you can quickly see whether a stock looks undervalued or overvalued.
See a stock’s true value in under 60 seconds (Free with TIKR) >>>
Looking for New Opportunities?
- See what stocks billionaire investors are buying so you can follow the smart money.
- Analyze stocks in as little as 5 minutes with TIKR’s all-in-one, easy-to-use platform.
- The more rocks you overturn… the more opportunities you’ll uncover. Search 100K+ global stocks, global top investor holdings, and more with TIKR.
Disclaimer:
Please note that the articles on TIKR are not intended to serve as investment or financial advice from TIKR or our content team, nor are they recommendations to buy or sell any stocks. We create our content based on TIKR Terminal’s investment data and analysts’ estimates. Our analysis might not include recent company news or important updates. TIKR has no position in any stocks mentioned. Thank you for reading, and happy investing!