Key Takeaways:
- Growth Holding Steady: Wix posted Q1 2026 revenue of $541 million, up 14% year-over-year, with new cohort bookings growing 46% compared to the same period last year.
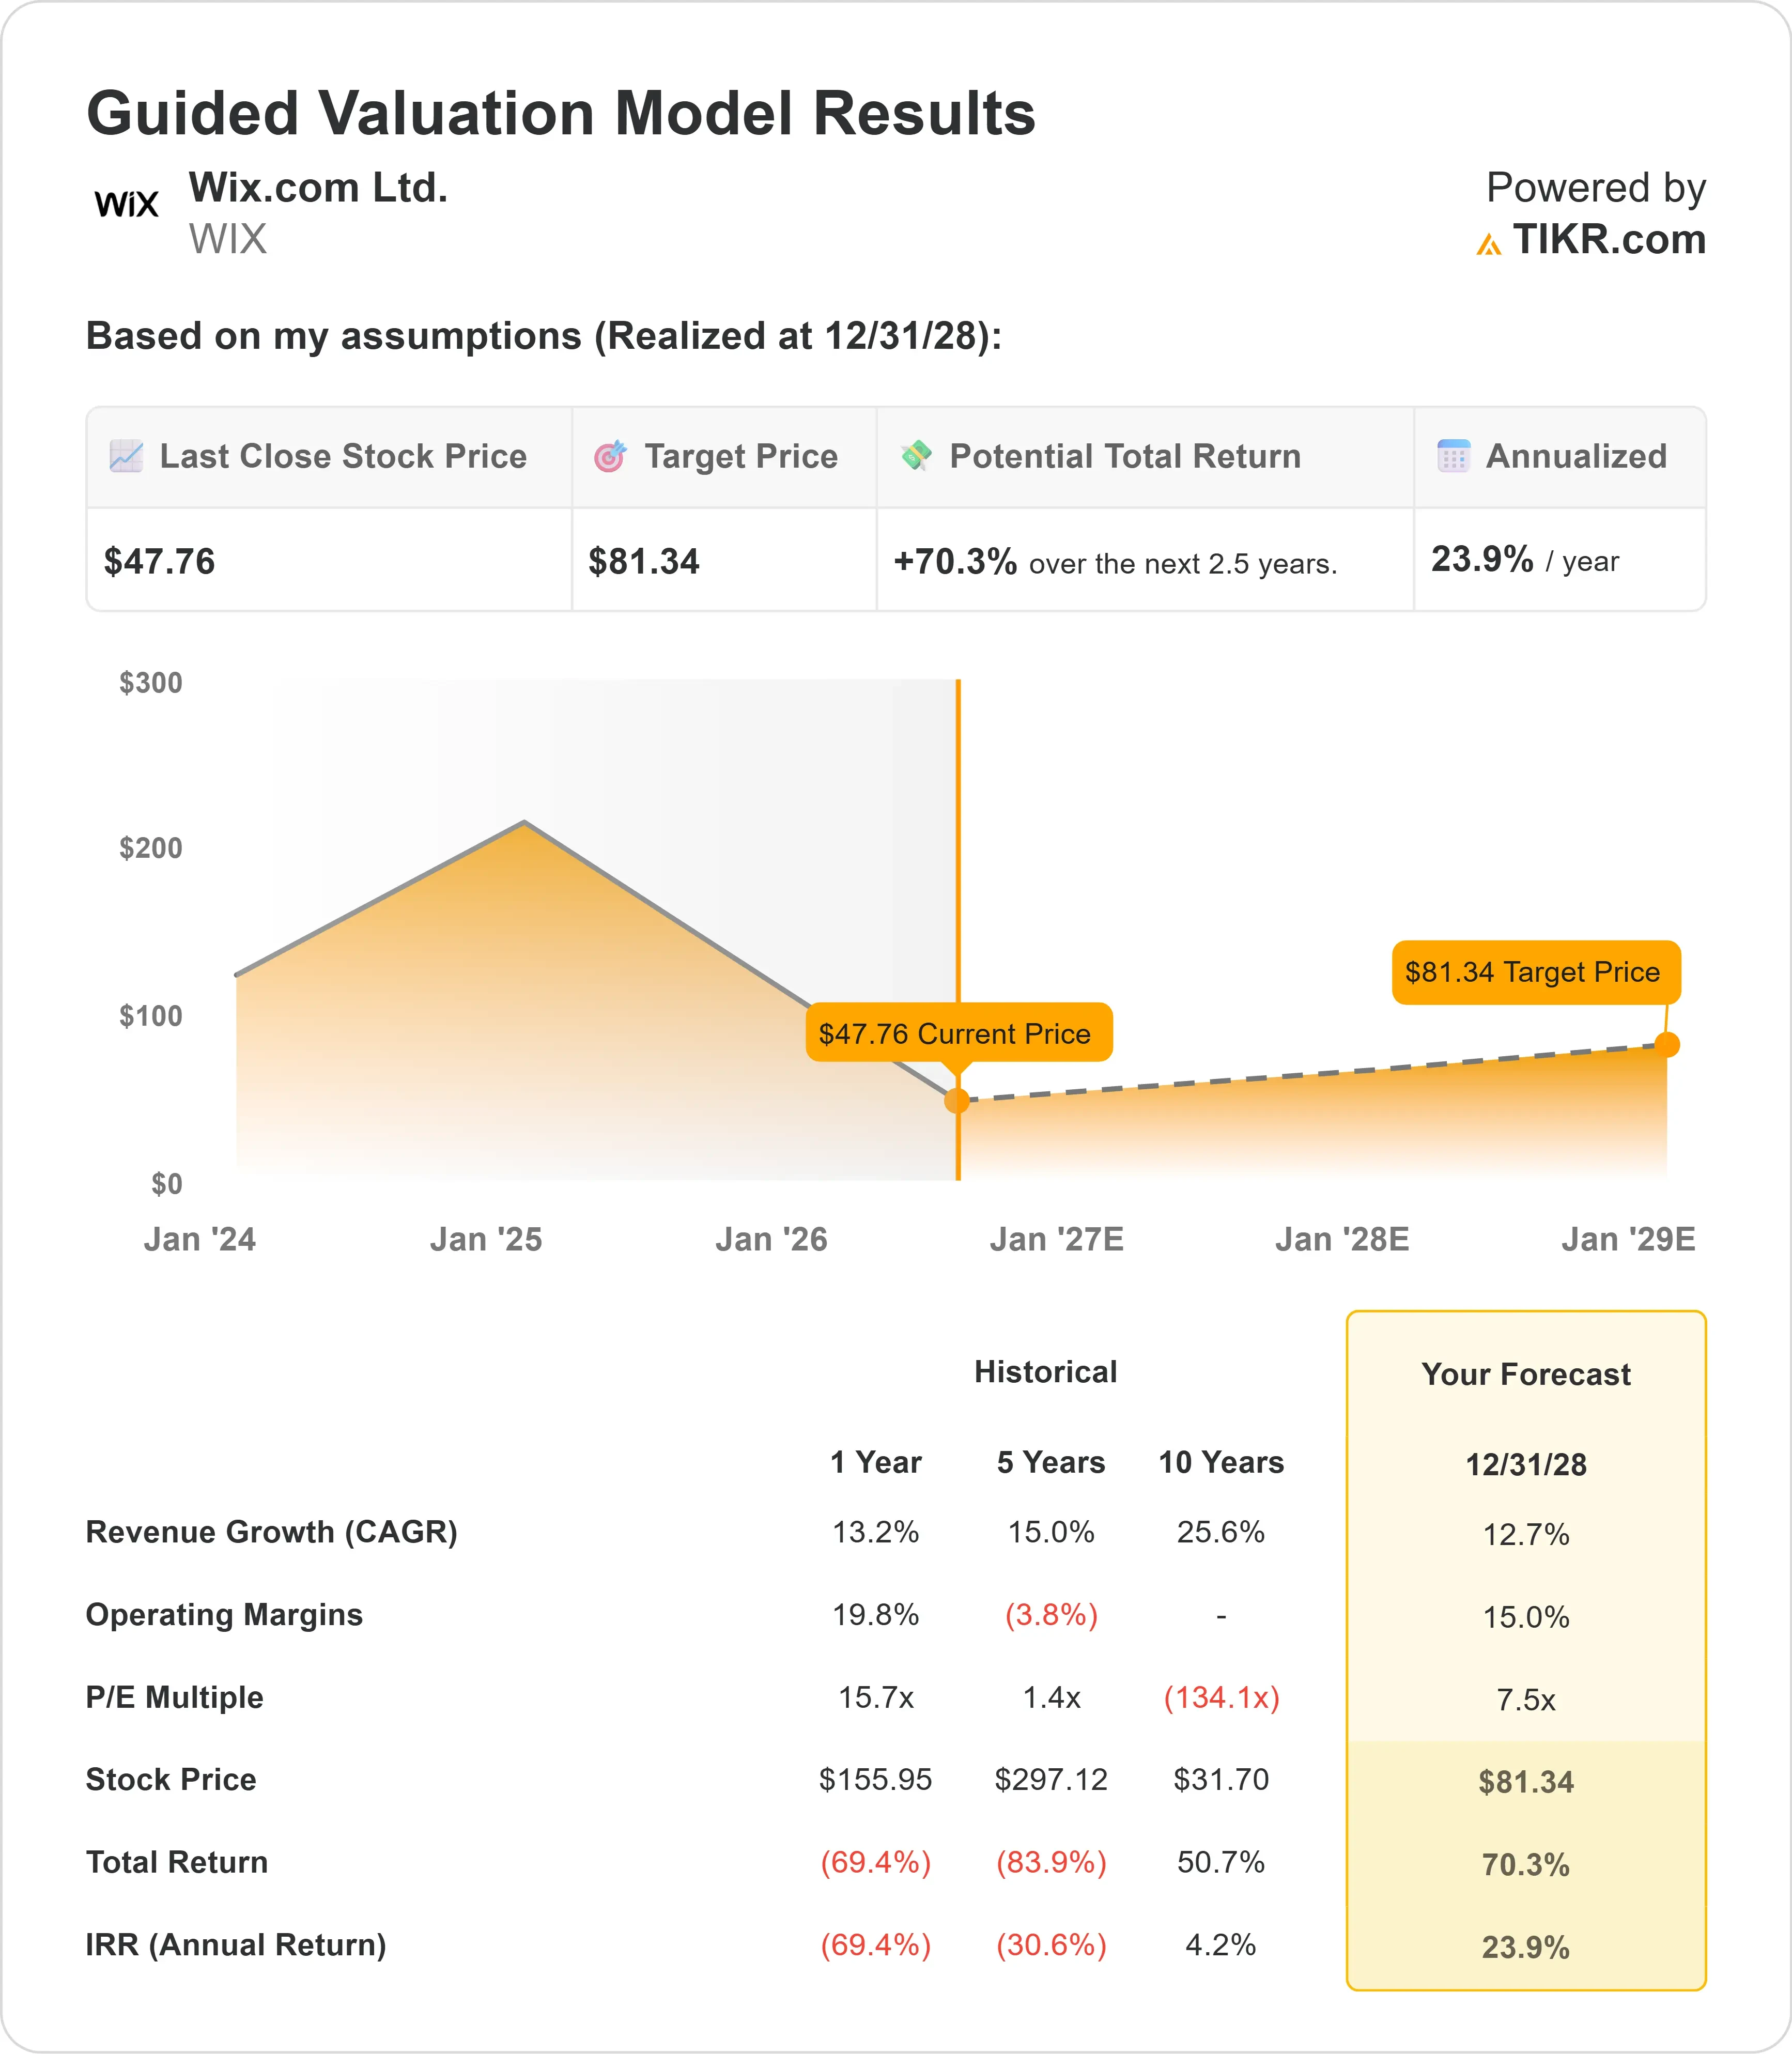
- Price Projection: Based on current assumptions, WIX stock could reach $81.34 by December 2028.
- Potential Gains: That target implies a total return of 70.3% from the current price of $47.76.
- Annual Return: Investors could see roughly 23.9% annualized growth over the next 2.5 years.
Now Live: Discover how much upside your favorite stocks could have using TIKR’s new Valuation Model (It’s free)>>>
Wix (WIX) peaked at roughly $200 in 2025 and has since fallen nearly 70%. The stock now trades at levels that reflect significant pessimism about its competitive position in an AI-disrupted web-creation market.
But the underlying business tells a more nuanced story. Q1 2026 revenue of $541 million grew 14% year over year. Total bookings hit $585 million, up 15%. New user cohort bookings grew 46% versus the year-ago period — the strongest cohort performance in years.
Free cash flow came in at $112 million, or 21% of revenue, and management reiterated full-year guidance for mid-teens revenue growth.
These are not the metrics of a business losing to AI. They look more like a business in the middle of a genuine product transition.
See analysts’ full growth forecasts and estimates for WIX stock (It’s free) >>>
What the Model Says for Wix.com Stock
We analyzed Wix through the lens of a company that is simultaneously defending its core web creation business and building a new AI-powered application platform.
The existing Wix business is performing well.
- Wix Harmony — the company’s new AI-powered website editor — rolled out in late January and is already showing tangible results.
- Conversion of new users to paid subscriptions improved meaningfully.
- Users are choosing higher-priced plans and adding more business solutions.
- Wix also just built and deployed its first proprietary LLM to power Harmony, reducing inference costs from expensive frontier models to what management described as “marginal cost.”
- That’s a meaningful structural margin improvement.
The bigger growth engine is Base44, the AI-powered app creation platform Wix acquired and which is now the largest in North America by market share.
- Base44 hit $100 million in ARR in early March and $150 million by mid-May — roughly six weeks later.
- Management is investing aggressively, with marketing spend returning in 7 to 9 months.
- Customer retention is improving as more users shift to annual subscriptions.
- Gross margins on Base44 are also improving quarter by quarter as the initial build phase — which is AI compute-intensive — gives way to lower-cost usage patterns.
The one soft spot is the partners channel, where Wix serves professional web designers and agencies.
- A deliberate pullback in studio-focused marketing has shrunk the partner funnel over recent quarters.
- Some product timelines for partners have also been pushed out due to the ongoing conflict in the Middle East, which has disrupted productivity for Wix’s Israel-based teams.
- Management expects this to remain a headwind through 2026.
Using a forecast of 12.7% annual revenue growth and 15% operating margins, with an exit P/E of 7.5x, our model projects WIX reaching $81.34 by December 2028. That’s a 70.3% total return, or 23.9% annualized.
The 7.5x P/E assumption is well below WIX’s current NTM multiple of 8.2x and the one-year average of 15.7x.
The low multiple reflects uncertainty around Base44’s long-term margin profile, competitive risk from vibe-coding platforms, and the share count dilution from the tender offer completed in April. Any re-rating toward historical norms would add significantly to returns.
Our Valuation Assumptions
Estimate a company’s fair value instantly (Free with TIKR) >>>
Our Valuation Assumptions
TIKR’s Valuation Model lets you plug in your own assumptions for a company’s revenue growth, operating margins, and P/E multiple, and calculates the stock’s expected returns.
Here’s what we used for Wix.com stock:
1. Revenue Growth: 12.7%
WIX grew revenues 13.2% last year and has compounded at 12.8% annually over three years.
The 12.7% assumption is essentially in line with recent history, reflecting steady Wix core growth plus an accelerating Base44 contribution, partially offset by the partner channel headwind.
2. Operating margins: 15%
Trailing EBIT margins are 19.1%, but they face near-term pressure from elevated Base44 AI costs and marketing spend.
The 15% assumption reflects a dip from current levels as Base44 scales, with a gradual recovery as inference costs decline and operating leverage builds.
3. Exit P/E Multiple: 7.5x
WIX currently trades at 8.2x forward earnings — near multi-year lows.
The model assumes modest further compression to 7.5x.
Any improvement in Base44’s profitability or a return to higher sustained growth could push this multiple meaningfully higher.
Build your own Valuation Model to value any stock (It’s free!) >>>
What Happens If Things Go Better or Worse?
Here’s how Wix.com stock could perform under different scenarios by December 2030:
- Low Case: With revenue growing at 10.8% and net income margins of 15.6%, investors could see a total return of 111.9% (18.2% annually).
- Mid Case: At 12% revenue growth and 16.5% net income margins, the total return climbs to 176.9% (25.5% annually).
- High Case: If revenue grows at 13.2% and margins reach 17.4%, total returns could hit 256.7% (32.8% annually).

See what analysts think about WIX stock right now (Free with TIKR) >>>
All three scenarios are driven heavily by P/E re-rating, since the model forecasts continued multiple compression even in the high case.
The upside is significant if Base44 proves durable and Wix’s own LLM strategy lowers AI costs fast enough to restore margins to historical levels.
How Much Upside Does Wix.com Stock Have From Here?
With TIKR’s new Valuation Model tool, you can estimate a stock’s potential share price in under a minute.
All it takes is three simple inputs:
- Revenue Growth
- Operating Margins
- Exit P/E Multiple
If you’re not sure what to enter, TIKR automatically fills in each input using analysts’ consensus estimates, giving you a quick, reliable starting point.
From there, TIKR calculates the potential share price and total returns under Bull, Base, and Bear scenarios so you can quickly see whether a stock looks undervalued or overvalued.
See a stock’s true value in under 60 seconds (Free with TIKR) >>>
Looking for New Opportunities?
- See what stocks billionaire investors are buying so you can follow the smart money.
- Analyze stocks in as little as 5 minutes with TIKR’s all-in-one, easy-to-use platform.
- The more rocks you overturn… the more opportunities you’ll uncover. Search 100K+ global stocks, global top investor holdings, and more with TIKR.
Disclaimer:
Please note that the articles on TIKR are not intended to serve as investment or financial advice from TIKR or our content team, nor are they recommendations to buy or sell any stocks. We create our content based on TIKR Terminal’s investment data and analysts’ estimates. Our analysis might not include recent company news or important updates. TIKR has no position in any stocks mentioned. Thank you for reading, and happy investing!