


Key Stats for Micron Stock
- Current Price: $904.28
- Target Price (Mid): ~$935 (realized 8/31/30)
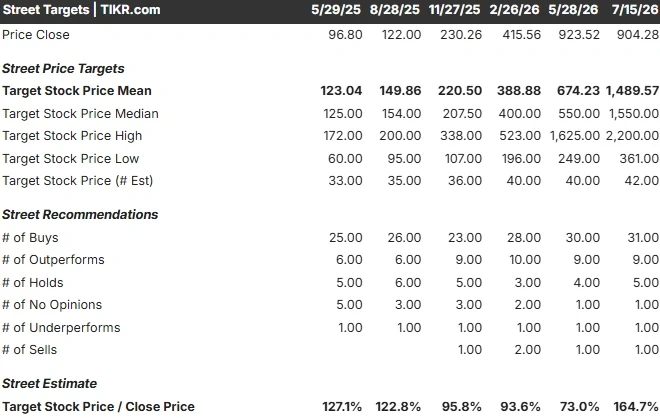
- Street Target: ~$1,490
- Potential Total Return: ~3%
- Annualized IRR: ~1% / year
- Max Drawdown: 30.31% on 3/30/26
Now Live: Discover how much upside your favorite stocks could have using TIKR’s new Valuation Model (It’s free) >>>
What Happened?
Micron Technology (MU) just printed the best quarter in its history, and on Wednesday, its stock fell 8.02% to close at $904.28. That is 27.9% below the 52-week high of $1,255.00.
Resist the obvious conclusion. Micron did not get singled out. AMD, Intel, and Marvell all dropped more than 5%, and the selling had already happened overnight in Asia, where the KOSPI fell 5%, and SK Hynix dropped more than 9%. This was the memory complex repricing together. Anyone selling you a Micron-specific story about Wednesday is working backward from the tape.
The argument worth having is quieter, and it has been running for months. Wall Street’s mean target is $1,489.57. TIKR’s mid-case model puts fair value at around $935 by 8/31/30. Both numbers come from people who have looked hard at the same company. The unresolved question underneath: is Micron’s earnings power permanent, or is it borrowed from a cycle that has not turned yet?
The Week Delivered a $1,750 Target and an $8.55 Billion Chinese IPO, in That Order
On July 14, KeyBanc’s John Vinh raised his Micron target to $1,750 from $1,600, a Street high, after walking the Asia supply chain. He wrote that supply chain commentary continues to point to a tight memory environment through 2027, and he expects DRAM (the working memory in servers and PCs) and NAND (the flash storage in drives) prices to climb by double digits through year-end. The stock rose 4.92% that day to $983.12.
The same week, ChangXin Memory Technologies priced its Shanghai STAR Market listing at 8.66 yuan per share, raising roughly 57.9 billion yuan, or about $8.55 billion. Reuters reported the terms from CXMT’s own filing on July 14. It is the largest Chinese A-share semiconductor offering ever, and the company doubled its original 29.5 billion yuan target. CXMT is the world’s fourth-largest DRAM maker at roughly 7.7% share in 2025.
Two opposite signals, two days apart. That is the actual state of this debate.
CXMT matters because scarcity is the whole thesis. On the June 24 earnings call, Sanjay Mehrotra, Chairman, President and CEO, put it as plainly as it can be put: “we currently do not have line of sight as to when memory supply will be able to catch up with increasing demand.” Funded capacity is the only thing that builds that line of sight. But CXMT has long been viewed as a technological laggard against Samsung and SK Hynix; it is not a near-term HBM competitor, and HBM (the stacked memory feeding AI accelerators) is where Micron’s margin actually lives. Nomura’s Greater China semiconductor analyst Donnie Teng, quoted in the same Reuters report, was blunt that the memory supply is still not enough.
Reports also circulated on July 15 that Washington is weighing tighter unilateral export restrictions on HBM. That is secondhand reporting of a deliberation, not a proposed rule, not a BIS action, and not attributed to a named official. Existing HBM controls date to December 2024.

See historical and forward estimates for Micron stock (It’s free!) >>>
The Quarter Was Extraordinary, Which Is Exactly Why the Bar Is So High
Fiscal Q3 2026 broke the company’s own frame of reference:
- Revenue: $41.456 billion, up 346% year over year, against a $35.82 billion consensus estimate
- Non-GAAP EPS: $25.11, versus $20.71 expected, up 106% sequentially
- Gross margin: 84.9%, up 10 points sequentially, a company record
- Operating margin: 81.2%, up 54 points year over year
Mark Murphy, CFO, noted the $17.6 billion sequential revenue increase was the largest in company history, eclipsing the prior quarter’s $10.2 billion record. Micron closed with $30.2 billion in cash and a $24.4 billion net cash balance. Shares rose 15.74% on the June 24 print, and management guided fiscal Q4 to $50 billion in revenue, around 86% gross margin, and $31 in EPS.
The market has now seen that guide. Shares still sit 27.9% off the high.
That is not skepticism about the quarter. Nobody disputes the quarter. It is skepticism about the years after it, because a 346% growth rate makes every subsequent comparison brutal. TIKR consensus has revenue reaching around $234 billion in fiscal 2027, then around $259 billion, then around $269 billion, before declining to roughly $240 billion in fiscal 2030. That is growth of around 80%, then around 11%, then under 4%, then a decline of around 11%. The Street is not modeling a permanent escape from the cycle. It is modeling a cycle with an unusually high peak, arriving in fiscal 2029.
Sixteen Contracts and $22 Billion in Deposits Are Real. The Coverage Is Still Building
Micron’s answer to the cyclicality charge is its strategic customer agreements, take-or-pay contracts binding customers to specific volumes over roughly five years. It has signed 16, spanning four very large customers, three medium-sized ones, and smaller automotive names. The company projects $22 billion in cash deposits and related commitments, about $18 billion of it cash and roughly $4 billion in letters of credit. Fourteen of the 16 carry cumulative minimum revenue of approximately $100 billion over the remaining term.
The number that matters most is not $100 billion. It is 25%.
Pressed by UBS analyst Timothy Arcuri to reconcile that $100 billion against a run rate far above it, Mehrotra was direct: “about 20% of DRAM and about 30% of our NAND volume is covered in these SCAs so far. So that amounts to about 25% of our revenue that you can project over the term of these agreements.”
A quarter of revenue, contracted and floored today. The rest are still priced at whatever the market says in 2028. Management’s stated destination is better: when all planned agreements are executed, it expects around 40% of revenue under fixed prices or ceilings, and approximately half or more of the company’s revenue under SCAs overall. Those are targets, not signatures.
The protection that exists is genuinely strong. Mehrotra said the floor prices deliver gross margins “well above our peak quarterly margins in any past cycle.” What that floor actually is, Micron would not say. Analysts on the call pushed twice, pegging the prior peak in the low 60s and probing for per-gigabyte ranges, and Mehrotra declined both times. So the honest version is this: the floor sits above a historical peak that management never confirmed, on a quarter of revenue. That is a materially better business than the one that used to lose money at the bottom. It is not a contracted business.
Murphy also confirmed the deposits are unrestricted cash, sit in financing cash flows, never touch free cash flow, and get returned to customers in the back half of the agreement terms.
See how Micron performs against its peers in TIKR (It’s free!) >>>
TIKR Advanced Model Analysis
- Current Price: $904.28
- Target Price (Mid): ~$935 (realized 8/31/30)
- Potential Total Return: ~3%
- Annualized IRR: ~1% / year

See analysts’ growth forecasts and price targets for Micron stock (It’s free!) >>>
This uses the mid case, which already carries assumptions most bulls would call aggressive: a revenue CAGR of around 14% and a net income margin of around 67%, roughly four and a half times Micron’s 15.1% five-year historical average. Grant all of it, and you get around $935 by 8/31/30. Roughly 3% total, about 1% a year, over four years. That is what “priced in” looks like when you do the arithmetic instead of asserting it. Stretch the same model to 8/31/34, and the mid case turns sharply negative, which is the model’s way of saying it expects the cycle to arrive eventually.
Two drivers carry the revenue line: data center DRAM and NAND, already above a $100 billion annualized run rate, and the HBM ramp, where HBM4 12-high is tracking twice as fast as HBM3E 12-high with over $1 billion already shipped. The margin driver is mix rather than price, as Micron steers bits toward higher-value products. The primary risk is that the roughly 75% of revenue outside signed agreements reprices into a greenfield supply wave; Mehrotra expects industry supply to improve gradually in 2028.
Upside: if margins hold near current levels through the next trough, the multiple compression baked into every scenario breaks down, and KeyBanc’s $1,750 looks prescient.
Downside: if that roughly 67% margin assumption slips into the 50s, this target moves from flat to clearly negative.
Worth noting what the model is not. Its target is a 4.1-year realization; the Street’s $1,489.57 is a 12-month mean, and that mean spans a range from $361.00 to $2,200.00 across 42 estimates. These are not two verdicts on the same question. They are two different questions, and both can be wrong.
Conclusion
Watch the fiscal Q4 gross margin. Micron guided to around 86%, and Murphy pre-announced the catch himself: that outlook “reflects a meaningful moderation in the rate of price increases.” The company is telling you the price tailwind is ending.
Hit 86% and mix, and yield carried the quarter without price, which is the only evidence that would validate the Street’s targets and break the model’s margin-compression assumption. Miss it meaningfully, and the roughly 67% net margin the mid case depends on starts failing in year one, and around $935 becomes the optimistic case rather than the flat one. Micron reported its last fiscal Q4 on September 23, so expect this one around late September, and check the company’s IR calendar for the confirmed date.
Wednesday told you the market’s appetite for memory risk is thin, which you already knew. September will tell you whether the margins are real.
See what stocks billionaire investors are buying so you can follow the smart money with TIKR.
Should You Invest in Micron?
The only way to really know is to look at the numbers yourself. TIKR gives you free access to the same institutional-quality financial data that professional analysts use to answer exactly that question.
Pull up Micron, and you’ll see years of historical financials, what Wall Street analysts expect for revenue and earnings in the quarters ahead, how valuation multiples have moved over time, and whether price targets are trending up or down.
You can build a free watchlist to track Micron alongside every other stock on your radar. No credit card required. Just the data you need to decide for yourself.
Looking for New Opportunities?
- See what stocks billionaire investors are buying so you can follow the smart money.
- Analyze stocks in as little as 5 minutes with TIKR’s all-in-one, easy-to-use platform.
- The more rocks you overturn… the more opportunities you’ll uncover. Search 100K+ global stocks, global top investor holdings, and more with TIKR.
Disclaimer:
Please note that the articles on TIKR are not intended to serve as investment or financial advice from TIKR or our content team, nor are they recommendations to buy or sell any stocks. We create our content based on TIKR Terminal’s investment data and analysts’ estimates. Our analysis might not include recent company news or important updates. TIKR has no position in any stocks mentioned. Thank you for reading, and happy investing!


