


Key Stats for Western Digital Stock
- Current Price: $513.84
- Target Price (Mid): ~$1,220
- Street Target: ~$630
- Potential Total Return: ~137%
- Annualized IRR: ~24% / year
- Max Drawdown: 31.14% on 7/15/26
Now Live: Discover how much upside your favorite stocks could have using TIKR’s new Valuation Model (It’s free) >>>
What Happened?
Western Digital Corporation (WDC) closed at $513.84, down 8.78% in a session, and set its deepest drawdown of the past twelve months in the process: 31.14%, dated July 15, 2026. Shares sit roughly 36% below the $799.87 they reached at the 52-week high.
The Street has not followed the price down. The mean target across covering analysts stands at around $630 as of July 15, up from around $575 on June 30, per TIKR. That gap is the whole question. Either analysts are slow to mark down a cycle that has turned, or the market is repricing a business whose economics have not changed.
The decline was not a Western Digital story. Memory and storage names sold off together as traders took profits after a violent run, with Micron and SanDisk falling alongside it. The proximate trigger was a reversal in SK Hynix, which gave back a chunk of a 27% single-day surge, and the sector followed. A separate headline, the Shanghai listing of Chinese DRAM maker ChangXin Memory Technologies at roughly $4.3 billion, added to the mood. What none of it touched was the thing that actually sets Western Digital’s earnings.
A Stock Up Sixfold in a Year Does Not Need a Reason to Fall 9%
Some context makes the drawdown less mysterious. Western Digital had risen enormously into July, and it was trading well below its 20-day moving average, the profile of a reset after an overheated run rather than a thesis breaking. When a stock has moved that far that fast, profit-taking does not require a catalyst proportionate to the decline. It requires an excuse, and the memory complex supplied several at once.
It is worth being precise about what the CXMT listing does and does not mean here, because the two stocks fell together on it. CXMT makes DRAM, the short-term working memory inside servers. Western Digital has not made a memory chip since February 21, 2025, when it completed the separation of its flash business into Sandisk and became a pure-play maker of hard disk drives, the spinning magnetic drives that store data permanently. A new DRAM competitor is a real problem for DRAM suppliers. Its read-through to nearline hard drive pricing is indirect at best.
That does not make the selloff irrational. It makes it a sector trade, and Western Digital is a passenger in it. The question a buyer has to answer is whether the passenger’s own economics survived the week, and for that, the relevant testimony is on the record.

See historical and forward estimates for Western Digital stock (It’s free!) >>>
The Spread That Decides Everything
CFO Kris Sennesael gave the number that matters at the 2026 Evercore Global TMT Conference on June 3, and it was not a demand number. On costs, he said they decline “on or about 10% year-over-year on a cost per terabyte basis” over the mid to long term. On price, he said that last quarter “our average ASP per terabyte was up 9% on a year-over-year basis.”
Price up 9%. Cost down 10%. That spread produces what he described next: incremental gross margins “in the 70%, 75% range.” The mechanism is almost embarrassingly simple, and he explained it: “it doesn’t cost that much more to produce a 40-terabyte drive versus a 32-terabyte drive.” Same assembly, more capacity, better price, lower unit cost. This industry historically ran price per terabyte down 10% a year. The reversal is the re-rating.
The customer structure is why it holds. As Sennesael put it, “90% of my business is cloud, still 5% consumer and 5% client.” Those hyperscalers are asking for supply agreements, some stretching to 2032, and placing firm orders 52 weeks ahead because that is how long a drive takes to build.
The pushback worth taking seriously came from Sennesael himself, unintentionally. Those long-term agreements carry “a volume component and a price component in there with some flexibility.” Flexibility runs both directions. If hyperscaler spending cools, that is the clause where it shows up, and a 70% incremental margin unwinds faster than it built.
What 21x Forward EBITDA Is Actually Pricing
The multiple has done most of the adjusting already. Western Digital trades at around 21x NTM EV/EBITDA as of July 15, down from around 28x on June 30, against a trailing figure near 45x. Forward P/E sits at around 32x on roughly $16 of forward normalized earnings per share. The drawdown was multiple compression, not an earnings revision.
Against peers, the discount is narrower than bulls might hope. Seagate Technology (STX), the closest comparable and the only other scaled Western supplier, trades at around 25x NTM EV/EBITDA and around 33x forward earnings, so Western Digital’s roughly 21x and 32x are a modest discount to a company facing identical demand. Dell Technologies (DELL) is far cheaper at around 15x, but Dell integrates systems rather than manufacturing storage media, and the margin structures are not comparable. The Seagate line is the one that counts, and the discount there is defensible against a forward two-year revenue CAGR of around 38%.
One item belongs in view even though it proves nothing. Insiders have been net sellers over the trailing three months, including a roughly $8.2 million sale by CEO Irving Tan on May 1 at around $412, per aggregated filings data. Executives sell for liquidity, taxes, and scheduled plans, and Sennesael himself made a small open-market purchase in March. Selling into a sixfold run is what most people would do. It is context, not a signal.

See how Western Digital performs against its peers in TIKR (It’s free!) >>>
TIKR Advanced Model Analysis
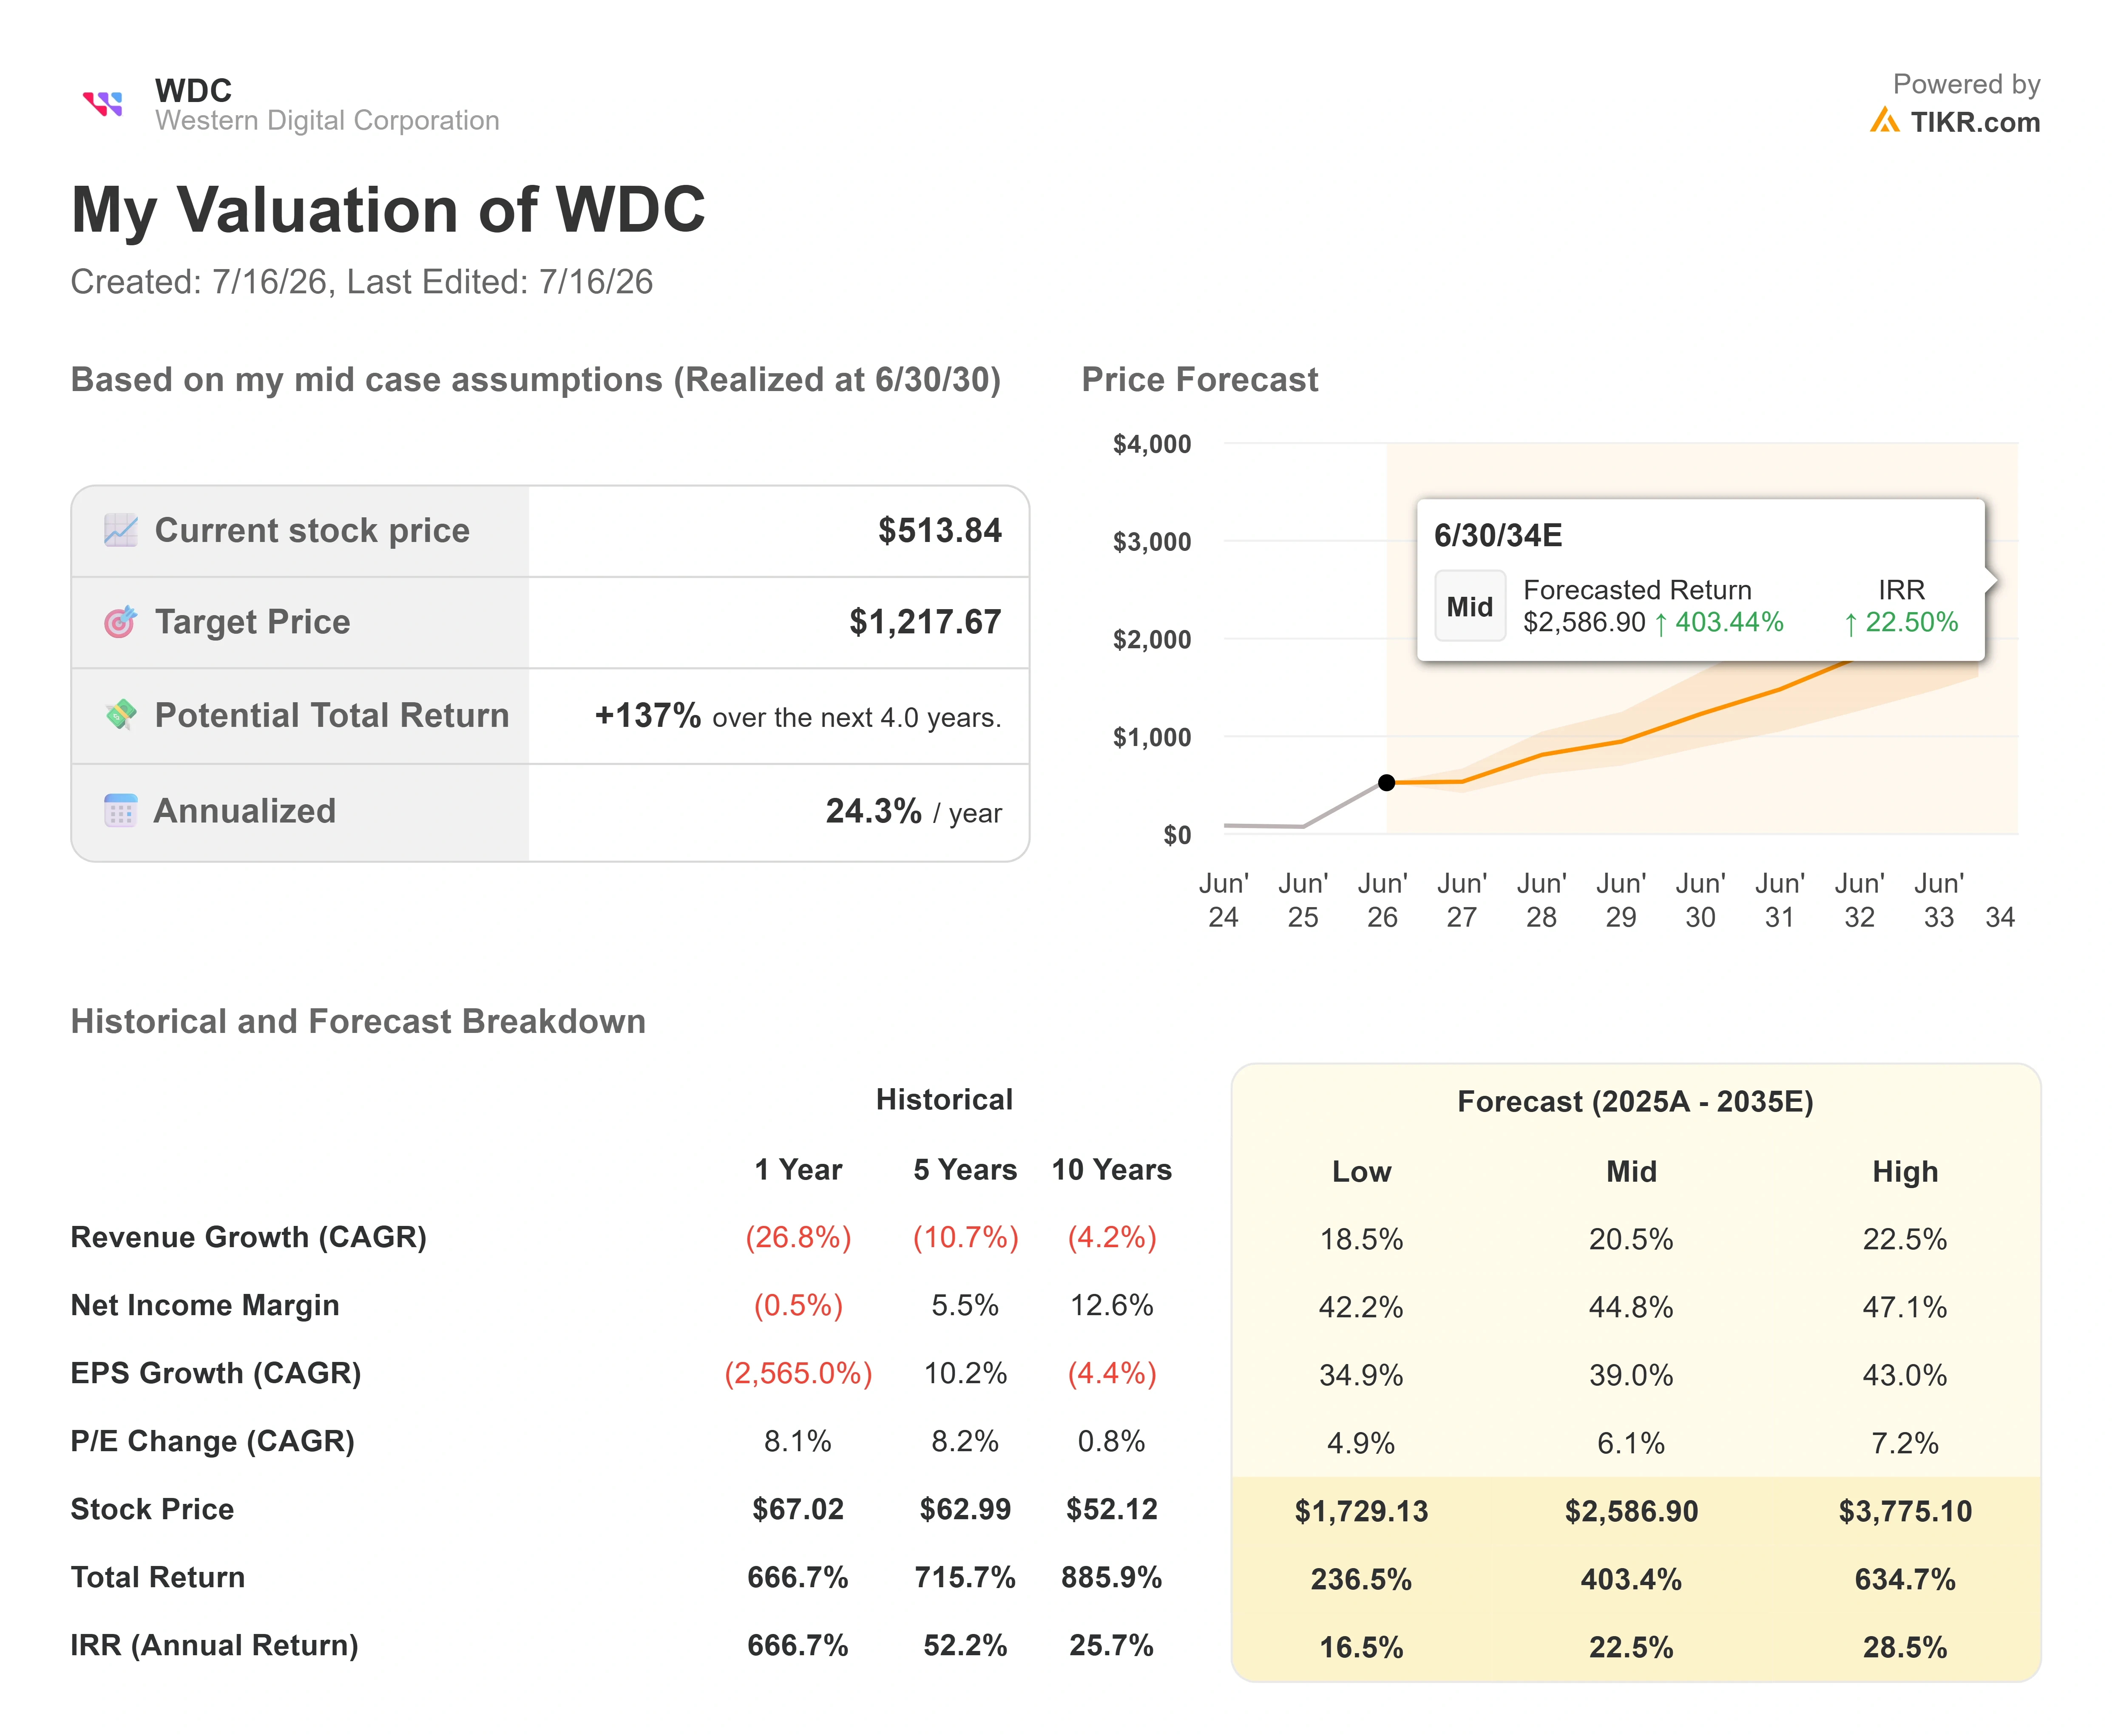
- Current Price: $513.84
- Target Price (Mid): ~$1,220
- Potential Total Return: ~137%
- Annualized IRR: ~24% / year
See analysts’ growth forecasts and price targets for Western Digital stock (It’s free!) >>>
Using the mid case, realized at 6/30/30, the TIKR model puts fair value at around $1,220, roughly 137% above the July 15 close over about four years.
Two drivers carry the roughly 21% revenue CAGR: the migration to higher-capacity drives, where 40-terabyte ePMR units are in qualification, and 44-terabyte HAMR drives sit behind them, and the hyperscaler long-term agreements that convert exabyte growth Sennesael pegs above 25% into visible orders. The margin driver is the price-up, cost-down spread, which the model carries to a mid-case net income margin of around 45%.
The primary risk is that the spread is a cycle rather than a structure. If cloud capital spending decelerates, the price flexibility inside those agreements gets used against Western Digital, and the margin and the multiple compress together.
Upside: pricing holds, the 40-terabyte ramp lands on schedule, and free cash flow compounds toward the mid case.
Downside: Capex cools, ASP per terabyte reverts to its historical decline, and a stock at 21x forward EBITDA finds out how far a cyclical multiple can fall.
Conclusion
August 5 is the test. Western Digital reports Q4 fiscal 2026 after the close, and management guided to $3.65 billion in revenue, plus or minus $100 million, with a non-GAAP gross margin of 51% to 52%.
Watch the margin line, not the revenue line. Revenue growth near 40% is already priced. A gross margin inside or above the guided 51% to 52% band means the price-up, cost-down spread survived a quarter in which the memory complex talked itself into a cycle top, and July looks like a sector trade that caught a stock with no cushion. A print below 51% means the flexibility inside those hyperscaler agreements has started moving in the customer’s favor, and targets near $630 come down to meet the price instead.
See what stocks billionaire investors are buying so you can follow the smart money with TIKR.
Should You Invest in Western Digital?
The only way to really know is to look at the numbers yourself. TIKR gives you free access to the same institutional-quality financial data that professional analysts use to answer exactly that question.
Pull up Western Digital, and you’ll see years of historical financials, what Wall Street analysts expect for revenue and earnings in the quarters ahead, how valuation multiples have moved over time, and whether price targets are trending up or down.
You can build a free watchlist to track Western Digital alongside every other stock on your radar. No credit card required. Just the data you need to decide for yourself.
Analyze Western Digital on TIKR Free →
Looking for New Opportunities?
- See what stocks billionaire investors are buying so you can follow the smart money.
- Analyze stocks in as little as 5 minutes with TIKR’s all-in-one, easy-to-use platform.
- The more rocks you overturn… the more opportunities you’ll uncover. Search 100K+ global stocks, global top investor holdings, and more with TIKR.
Disclaimer:
Please note that the articles on TIKR are not intended to serve as investment or financial advice from TIKR or our content team, nor are they recommendations to buy or sell any stocks. We create our content based on TIKR Terminal’s investment data and analysts’ estimates. Our analysis might not include recent company news or important updates. TIKR has no position in any stocks mentioned. Thank you for reading, and happy investing!