Key Stats for Procter & Gamble Stock
- 52-Week Range: $137.62 to $167.25
- Current Price: $148.05
- Street Mean Target: $163.43
- Market Cap: $345 billion
- Q3 FY2026 Net Sales: $21.2 billion (up 7% year over year)
- Q3 FY2026 Organic Sales Growth: 3%
- Q3 FY2026 Core EPS: $1.59
- Dividend Yield: 3.0%
- Consecutive Annual Dividend Increases: 70 years
Most investors never know if a stock is truly undervalued or overpriced. TIKR’s professional-grade valuation tools give you a clear, data-backed answer across 60,000+ stocks for free →
Trading at Its Long-Term Average Multiple After a Messy Year for Consumer Staples
Procter & Gamble (PG) is one of those businesses most investors think they understand, and most of the time, they are right. Tide, Pampers, Gillette, Oral-B: the company sells products that sit in virtually every household in the developed world, and it has done so profitably for over a century.
What is less appreciated is that P&G’s valuation premium has quietly compressed over the past few years, and the stock now trades close to its historical average rather than the lofty levels it commanded between 2019 and 2022.
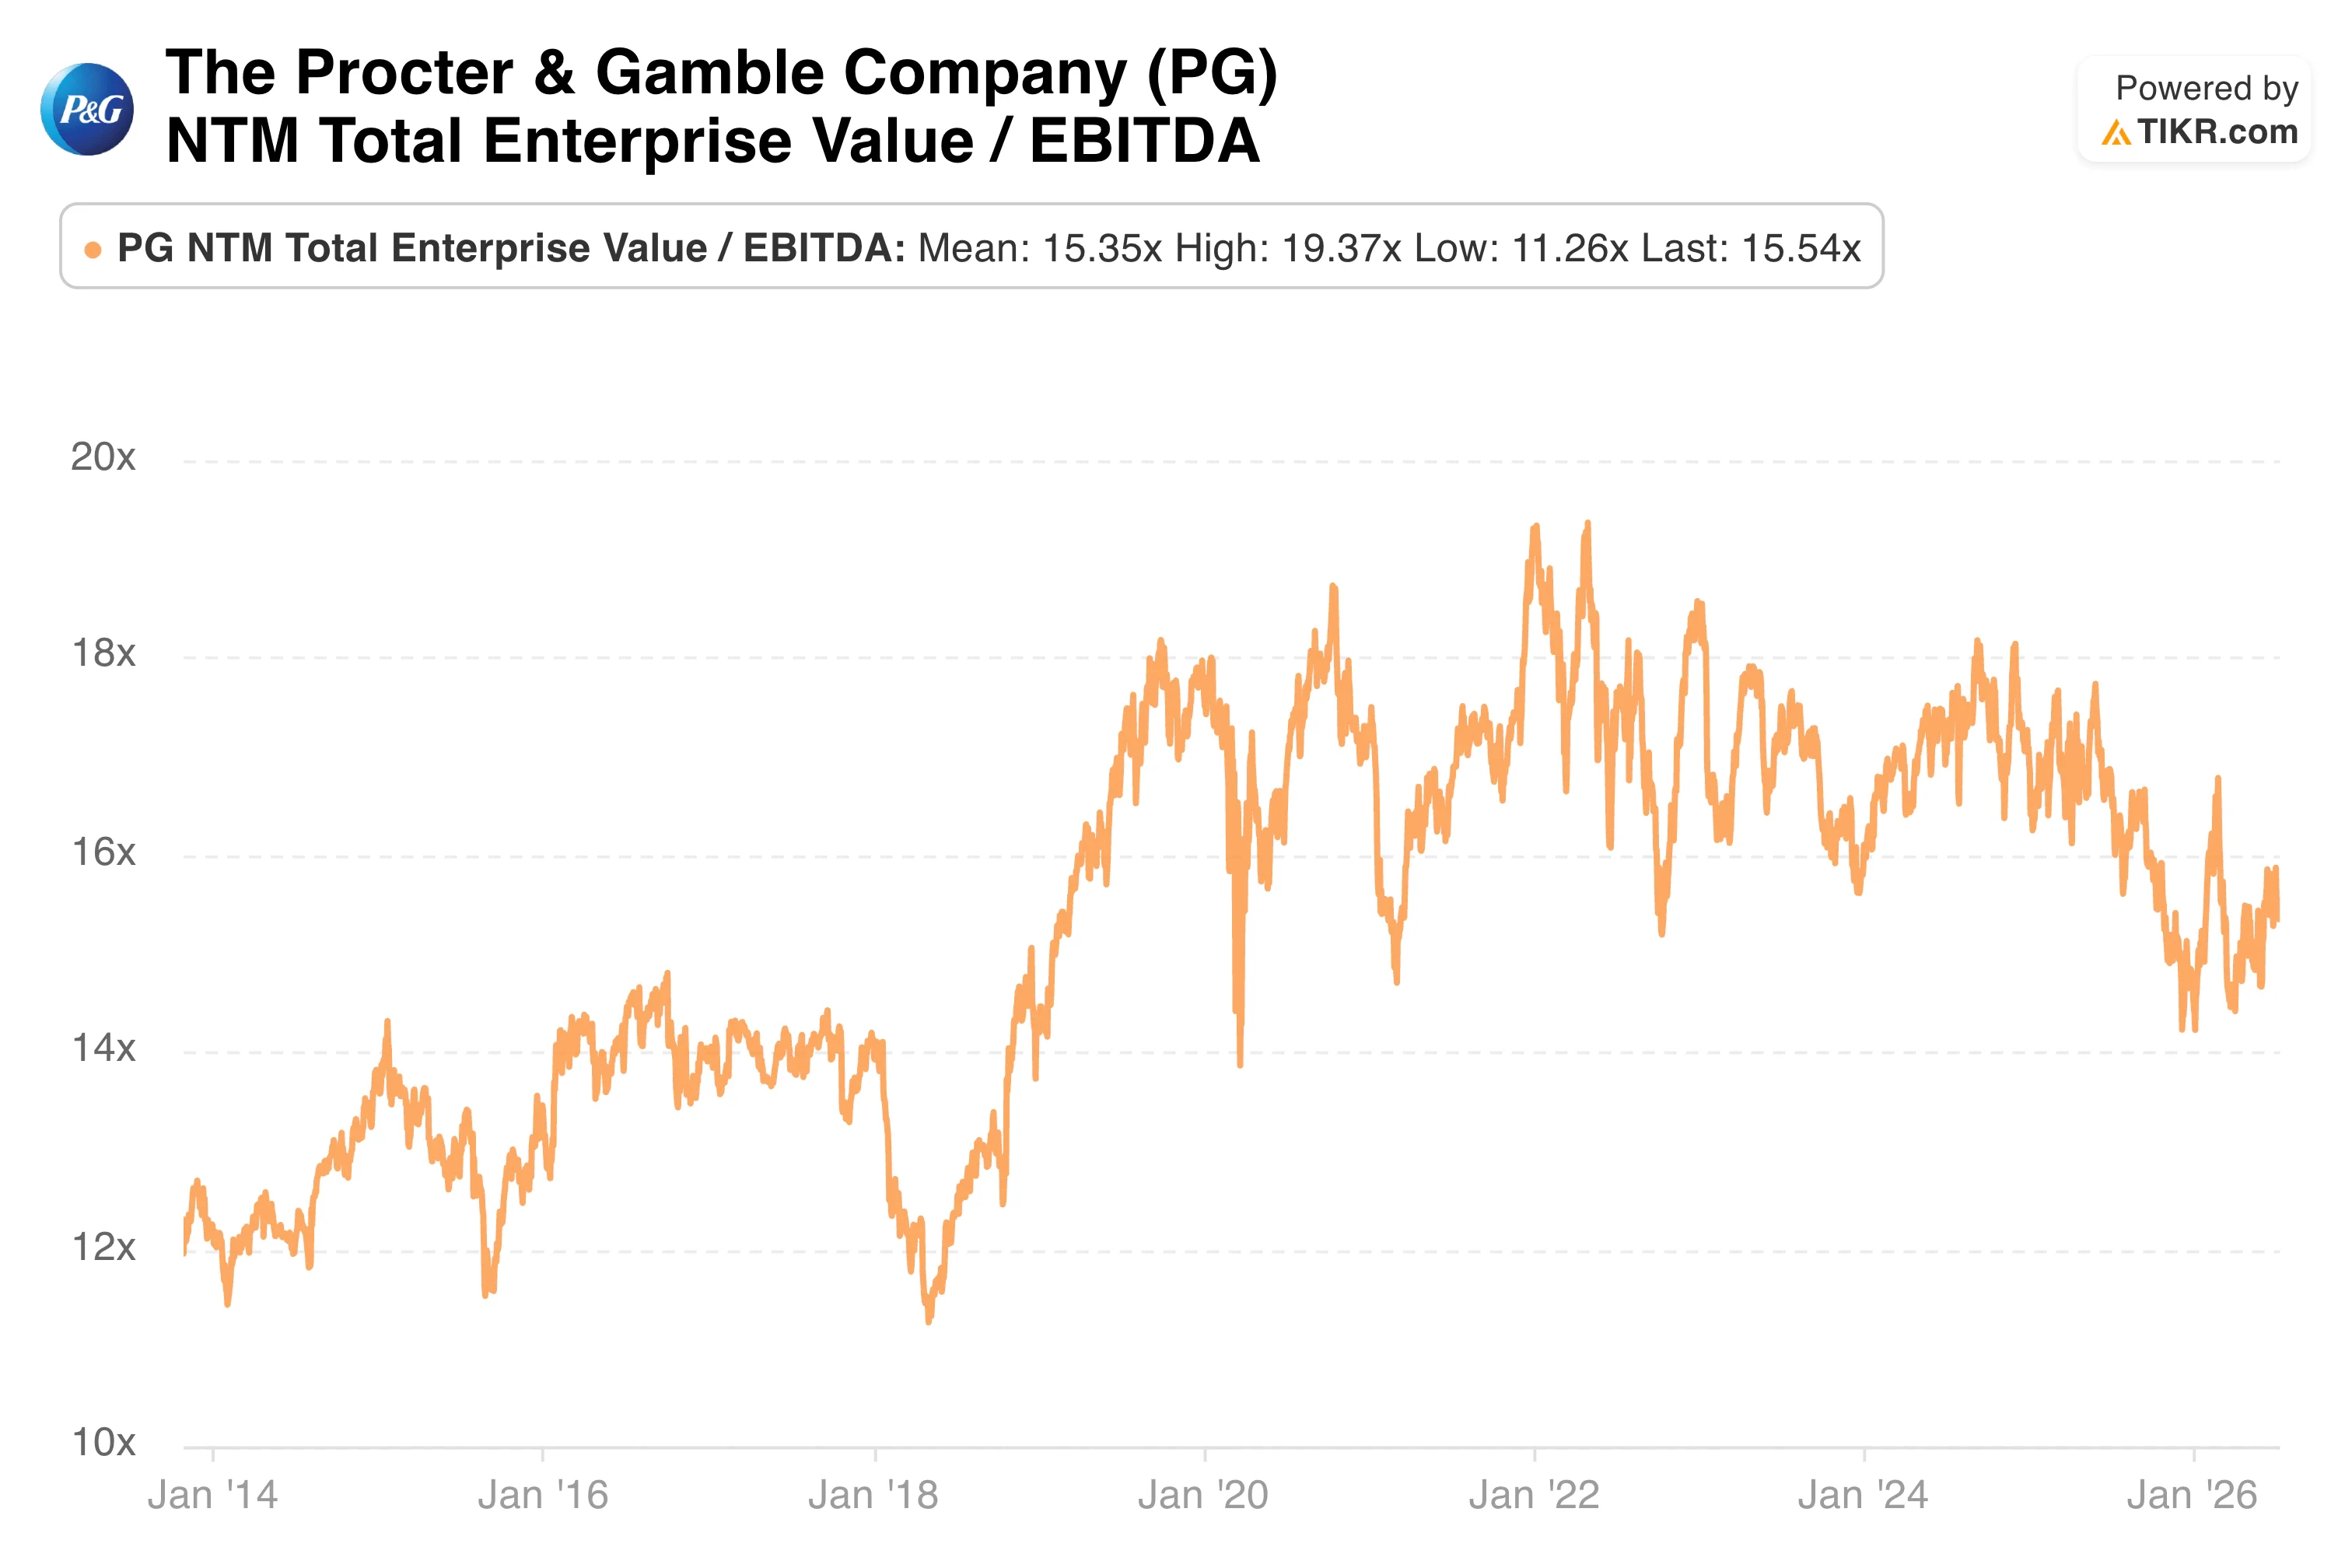
The NTM EV/EBITDA chart puts that in perspective across more than a decade. The multiple expanded from around 12x to 13x before 2019, then peaked at nearly 19x in 2021 and 2022, driven by pandemic-era defensive buying and record organic growth. It has since drifted back to 15.54x, almost exactly in line with the long-term mean of 15.35x.
For investors who worried that P&G was permanently overvalued coming out of the pandemic, the multiple compression has done much of the work.
Whether the earnings power justifies today’s price now depends largely on how the business handles tariffs.
See historical and forward estimates for PG stock (It’s free!) >>>
The Margin Recovery That Took Three Years Could Face a New Test
The gross margin chart tells one of the more underappreciated stories in consumer staples over the past five years. P&G entered 2022 with around 51% gross margins, then watched them collapse to 47.4% as commodity inflation and supply chain disruptions hit simultaneously.
Rather than accepting permanently lower profitability, the company pushed through price increases across its portfolio and invested aggressively in productivity savings. By fiscal 2024, gross margins had fully recovered to 51.7%, essentially back where they started.

The reason this matters now is that a fresh round of cost pressure has arrived.
Management flagged around $400 million in after-tax tariff headwinds for fiscal 2026, on top of commodity- and oil-related pressures, and guided results toward the lower end of its full-year range.
Organic sales grew 3% in the most recent quarter, supported by both volume and pricing, which is encouraging given how cautious consumers have become.
CEO Shailesh Jejurikar said the company is increasing investments to accelerate consumer momentum despite the challenging environment, signaling a deliberate choice to protect long-term market share over near-term margins.
Whether gross margins hold above 50% through this next cycle is the most important thing to watch.
Access Professional Tools to Analyze PG stock on TIKR for Free →
What the TIKR Model Implies About P&G Returns From Here
The TIKR valuation model for Procter & Gamble is straightforward and honest. Based on mid-case assumptions, the model projects a stock price of around $201 over the next four years, implying a total return of roughly 36% and an annualized IRR of around 8%.
The longer-range mid-case out to June 2034 reaches $256, implying a 7% annual return. The low case is around 4% annually, and the high case is around 10%.
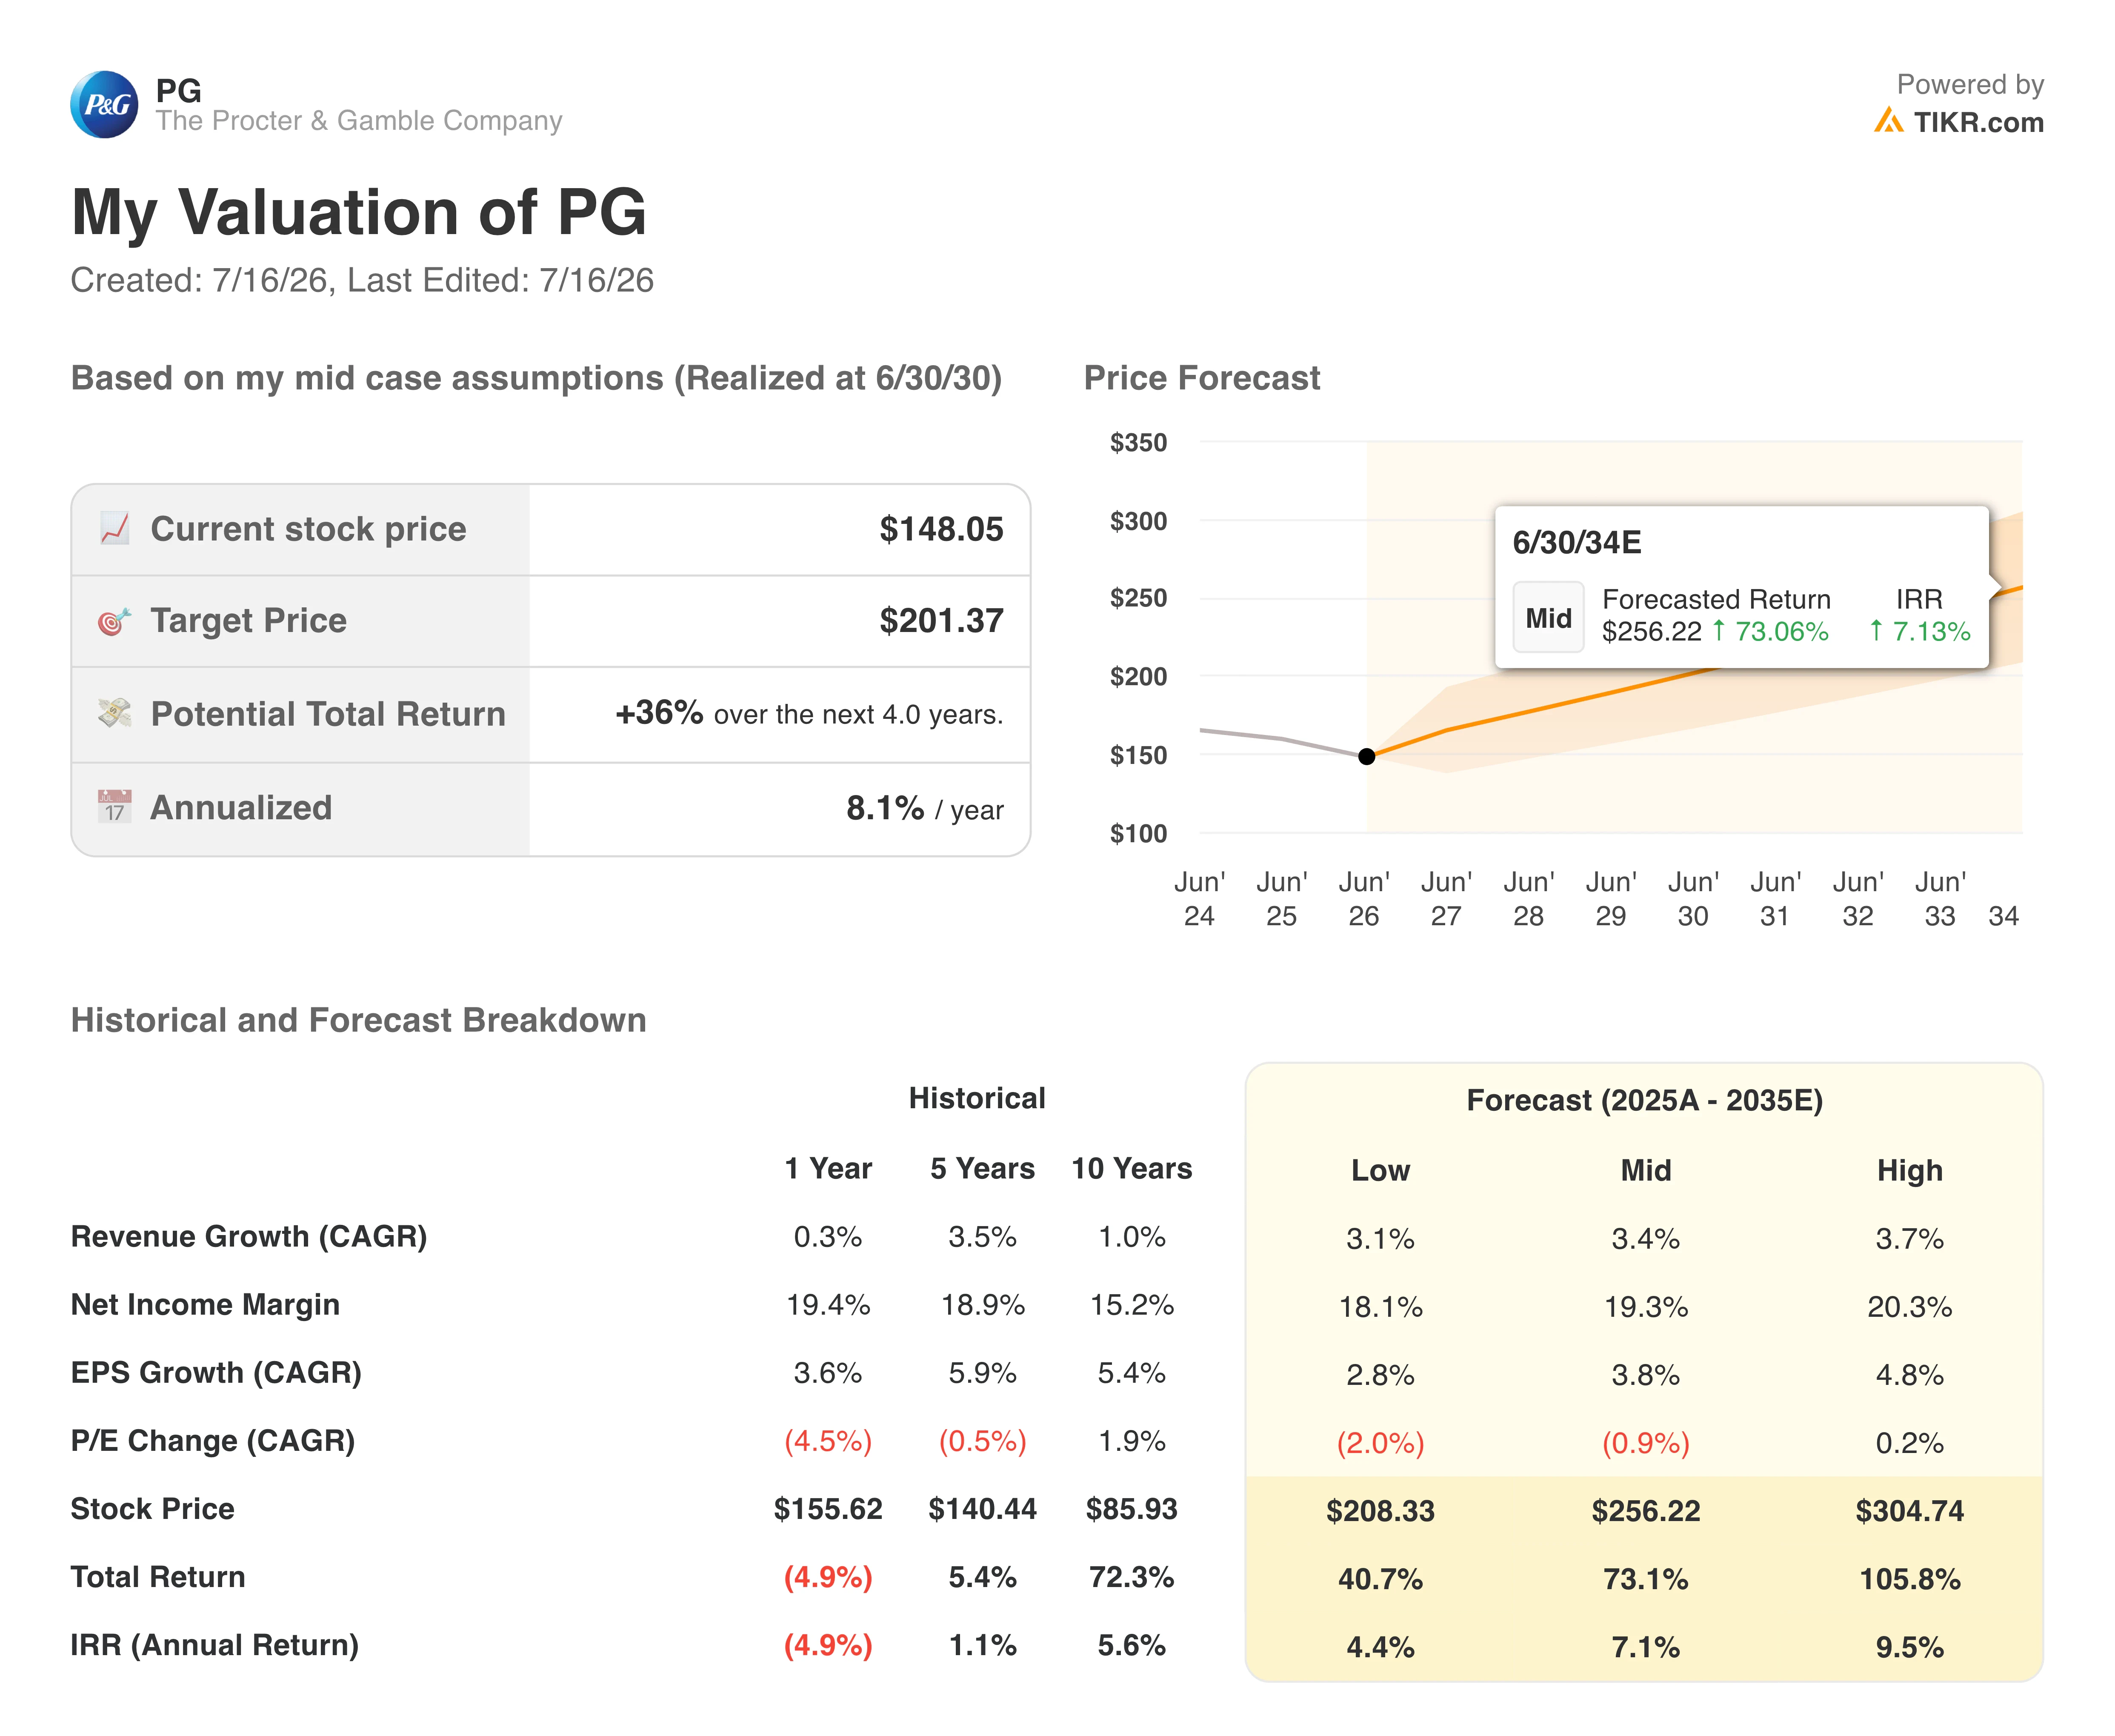
Those returns are driven almost entirely by modest earnings growth compounding over time, around 4% EPS growth annually in the mid-case, with essentially no help from multiple expansion.
The model actually assumes slight P/E compression of around 1% per year, which is the honest read given where the stock sits relative to history. For investors already holding P&G as a core defensive position, an 8% annualized return including dividends is a reasonable baseline.
For those deciding whether to initiate, the more relevant question is whether that return adequately compensates for the tariff and volume risks the business is currently navigating.
Should You Invest in Procter & Gamble?
Procter & Gamble is not a stock that will make anyone rich quickly, and it is not trying to be. What it offers is a 70-year dividend growth track record, a portfolio of category-leading brands with genuine pricing power, and a business model that has proven it can recover from cost shocks.
The tariff headwinds are real, and the near-term earnings growth is modest, but neither changes the long-term durability of the franchise. For investors building a portfolio around income and stability, P&G remains one of the more reliable anchors available.
TIKR’s model implies 36% upside from $148 over four years. Stress-test those assumptions yourself. Build a PG valuation model on TIKR for free →
Looking for New Opportunities?
- See what stocks billionaire investors are buying so you can follow the smart money.
- Analyze stocks in as little as 5 minutes with TIKR’s all-in-one, easy-to-use platform.
- The more rocks you overturn… the more opportunities you’ll uncover. Search 100K+ global stocks, global top investor holdings, and more with TIKR.
Disclaimer:
Please note that the articles on TIKR are not intended to serve as investment or financial advice from TIKR or our content team, nor are they recommendations to buy or sell any stocks. We create our content based on TIKR Terminal’s investment data and analysts’ estimates. Our analysis might not include recent company news or important updates. TIKR has no position in any stocks mentioned. Thank you for reading, and happy investing!