Key Takeaways:
- Corporate Reset: Home Depot cut 800 support roles and returned corporate staff to 5 days in office, tightening execution as Home Depot targets faster decision-making across 2350 stores.
- Pro Platform Expansion: Home Depot launched AI-driven material list tools and expanded Pro financing, supporting a $600 billion Pro market where Home Depot generates over $90 billion in annual Pro sales.
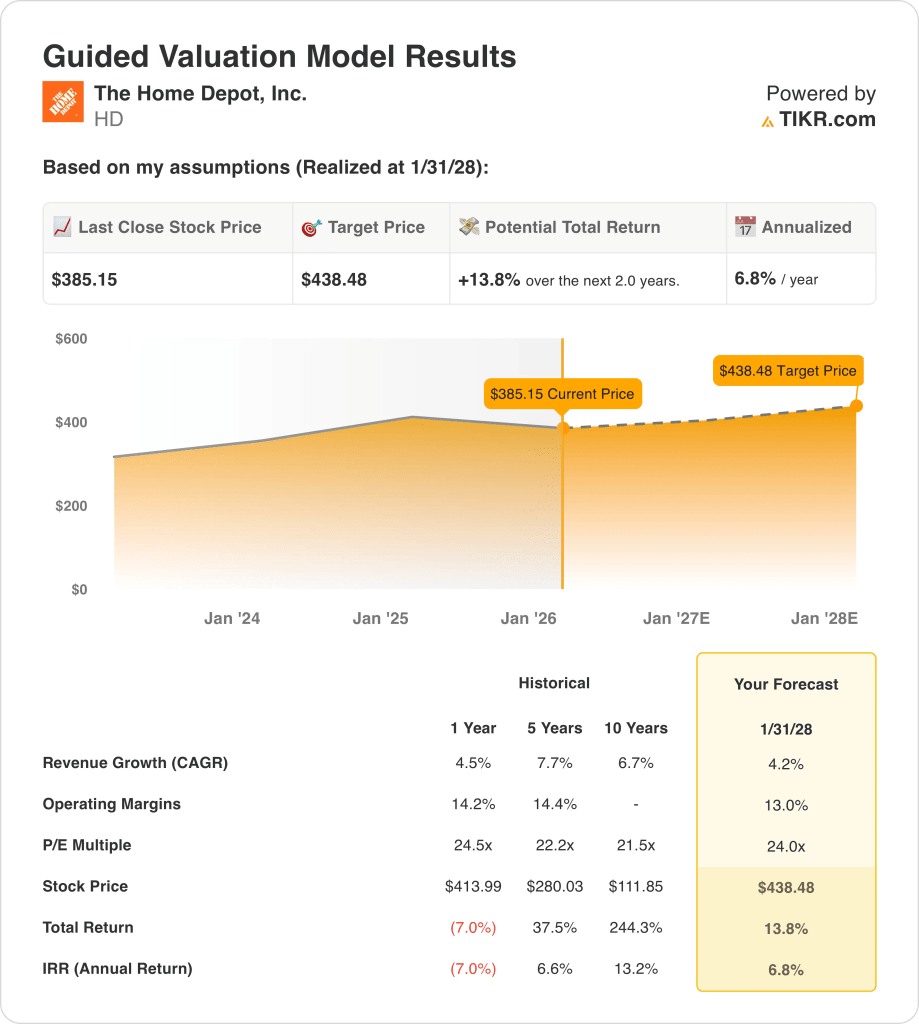
- Valuation Anchor: Based on 4% revenue growth, 13% operating margins, and a 24x exit multiple, Home Depot stock reflects a $438 target price by 2028 as earnings stabilize.
- Return Math: From a $385 price, the $438 target implies 14% total upside for Home Depot, equating to a 7% annualized return over 2 years.
Home Depot, Inc. (HD) generates revenue by selling home improvement goods and services through over 2350 stores, serving DIY customers and Pros across a $1100 billion North American market with roughly 15% share.
Home Depot produced $160 billion in revenue, $55 billion in gross profit, $34 billion in operating expenses, and $22 billion in operating income, translating to a 13% operating margin after multiple years of post-pandemic normalization.
Last month, Home Depot cut 800 corporate roles and enforced a 5 day return-to-office policy, reflecting management focus on cost discipline and execution speed after revenue grew 4% last year.
Management emphasized strategic urgency when CEO, Ted Decker stated, “We are simplifying our operations so we can move faster and stay more closely connected to our frontline associates,” framing priorities for 2026 and beyond around agility.
Priced at about 24x earnings with a $438 modeled value against $385 today, Home Depot sits between $20 billion in durable operating income and market expectations for a housing recovery over the next 2 years.
What the Model Says for HD Stock
Home Depot’s scale and capital intensity constrain returns, keeping operating margins near 13.0% despite strong competitive positioning.
However, the model assumes 4.2% revenue growth, 13.0% margins, and a 24.0x exit multiple, yielding a $438.48 target.
Therefore, the 13.8% total upside and 6.8% annualized return underperform equity alternatives, limiting compensation for housing-cycle risk.
The model signals a Sell for HD stock, as a 6.8% annualized return fails disciplined equity risk thresholds.
Given a modeled 6.8% annualized return below a typical 10% equity hurdle, expected gains favor capital preservation over appreciation, offering insufficient risk compensation and justifying a Sell based on valuation discipline.
Our Valuation Assumptions
TIKR’s Valuation Model lets you plug in your own assumptions for a company’s revenue growth, operating margins, and P/E multiple, and calculates the stock’s expected returns.
Here’s what we used for Home Depot stock:
1. Revenue Growth: 4.2%
Home Depot stock’s revenue base reflects a mature home improvement market, with 1-year historical growth of 4.5% following normalization from pandemic-driven demand.
Current sales are supported by a $90 billion Pro business, store-led fulfillment across 2350 locations, and delivered sales representing roughly 30% of total revenue.
Sustaining 4.2% growth requires steady Pro demand, stable consumer repair spending, and no material pullback in big-ticket discretionary categories.
This is below the 1-year historical revenue growth of 4.5%, indicating the model assumes modest deceleration consistent with a mature, late-cycle demand profile.
2. Operating Margins: 13%
HD stock’s operating margins averaged 14.2% over the past year, reflecting scale benefits partially offset by labor and supply-chain normalization.
Current profitability is anchored by $55 billion in gross profit against $34 billion in operating expenses, producing roughly $22 billion in operating income.
Maintaining 13.0% margins depends on cost discipline following workforce reductions, stable wage trends, and limited reinvestment pressure during a flat housing environment.
In line with analyst consensus projections, any revenue softness would first erode margin stability, as fixed store and distribution costs leave limited flexibility to protect earnings.
This is below the 1-year historical operating margin of 14.2%, indicating the model assumes modest compression tied to normalization rather than operational deterioration.
3. Exit P/E Multiple: 24x
Home Depot stock has traded near a 24.5x multiple over the past year, reflecting earnings durability and market confidence in long-term housing fundamentals.
The 24.0x exit multiple aligns with stable net income generation supported by approximately $15 billion in normalized earnings at the end of the forecast period.
This multiple requires consistent execution, stable cash flows, and no material deterioration in housing-related sentiment or competitive positioning.
Based on street consensus estimates, any earnings disappointment would likely result in multiple compression rather than expansion, amplifying downside even if operating results remain profitable.
This is below the 1-year historical P/E multiple of 24.5x, indicating the model assumes slight valuation normalization rather than a re-rating driven by growth acceleration.
What Happens If Things Go Better or Worse?
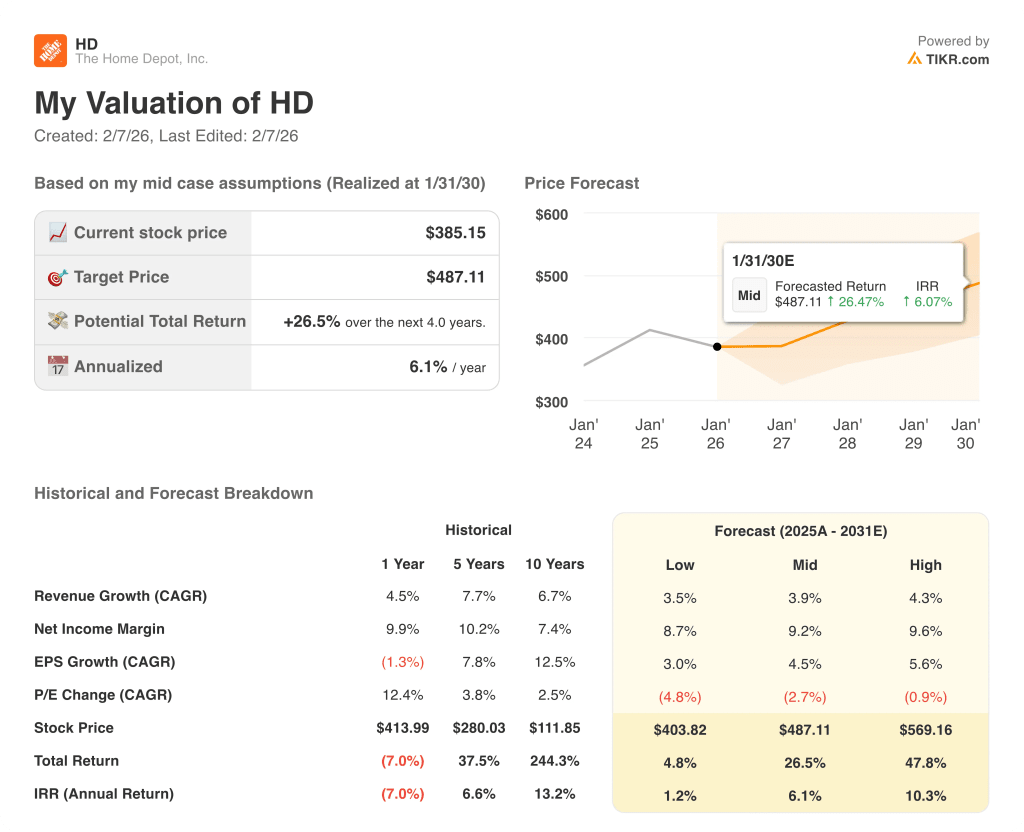
Home Depot stock outcomes depend on housing repair demand, Pro customer spending, and cost discipline, setting up a range of possible paths through 2030.
- Low Case: If repair demand softens and Pro spending stalls, revenue grows around 3.5% and margins stay near 8.7% → 1.2% annualized return.
- Mid Case: With core Pro demand holding and costs controlled, revenue growth near 3.9% and margins improving toward 9.2% → 6.1% annualized return.
- High Case: If Pro volumes reaccelerate and operating discipline holds, revenue reaches about 4.3% and margins approach 9.6% → 10.3% annualized return.
How Much Upside Does Home Depot Stock Have From Here?
With TIKR’s new Valuation Model tool, you can estimate a stock’s potential share price in under a minute.
All it takes is three simple inputs:
- Revenue Growth
- Operating Margins
- Exit P/E multiple
If you’re not sure what to enter, TIKR automatically fills in each input using analysts’ consensus estimates, giving you a quick, reliable starting point.
From there, TIKR calculates the potential share price and total returns under Bull, Base, and Bear scenarios so you can quickly see whether a stock looks undervalued or overvalued.
Looking for New Opportunities?
- See what stocks billionaire investors are buying so you can follow the smart money.
- Analyze stocks in as little as 5 minutes with TIKR’s all-in-one, easy-to-use platform.
- The more rocks you overturn… the more opportunities you’ll uncover. Search 100K+ global stocks, global top investor holdings, and more with TIKR.
Disclaimer:
Please note that the articles on TIKR are not intended to serve as investment or financial advice from TIKR or our content team, nor are they recommendations to buy or sell any stocks. We create our content based on TIKR Terminal’s investment data and analysts’ estimates. Our analysis might not include recent company news or important updates. TIKR has no position in any stocks mentioned. Thank you for reading, and happy investing!