Key Takeaways:
- Advantaged Upstream Mix: Exxon Mobil stock anchors its 2030 plan on Guyana at about 875,000 barrels per day and Permian at 1,800,000 oil equivalent barrels per day, pushing advantaged assets toward 65% of the upstream portfolio.
- Low Carbon Buildout: Exxon Mobil stock adds optionality as management targets multiple CCS start-ups in Texas and Louisiana in 2026 and expects first LNG at Golden Pass in March 2026.
- Valuation Anchor: Exxon Mobil stock implies a $147 target by December 2028 using about 2% revenue growth, 14% operating margins, and a 14x exit P/E as earnings normalize through the cycle.
- Return Math: Exxon Mobil stock at $146 versus a $147 target implies about 1% total upside and 0% annualized return over roughly 3 years which signals the current price already discounts the base-case fundamentals.
Exxon Mobil (XOM) generates revenue across upstream oil and gas, refining fuels, and chemical and specialty products, with $332B of 2025 revenue reflecting scale across energy, chemicals, and performance materials sold under the Exxon, Esso, and Mobil brands.
Last year, $97B of gross profit was partially offset by roughly $54B of operating expenses which resulted in about $43B of operating income and operating margins near 13% as downstream and chemicals cyclicality flowed through results.
Exxon Mobil is steering capital toward advantaged barrels and technology-led execution.
Furthermore, CEO Darren Woods said on the January 2026 earnings call that “there is no near-term peak Permian for us,” citing more than 40 technologies currently in testing.
The company frames the next leg of earnings power as structural, guiding to about $25B of earnings growth and $35B of cash flow growth from 2024 to 2030 while targeting $20B of savings by 2030 versus 2019.
XOM stock at $146 and about 14x earnings prices in a steady path, leaving the debate centered on whether $332B revenue durability and 13% margins justify only about 1% upside to $147 by 2028.
What the Model Says for XOM Stock
Exxon Mobil stock’s capital intensive upstream and downstream mix constrains expectations, keeping revenue growth assumptions modest at 2.3%.
However the model applies 13.5% operating margins and a 13.9x exit multiple, yielding a $146.81 target price.
Thus, the modeled 0.5% total upside and 0.2% annualized return fail basic equity opportunity cost tests.
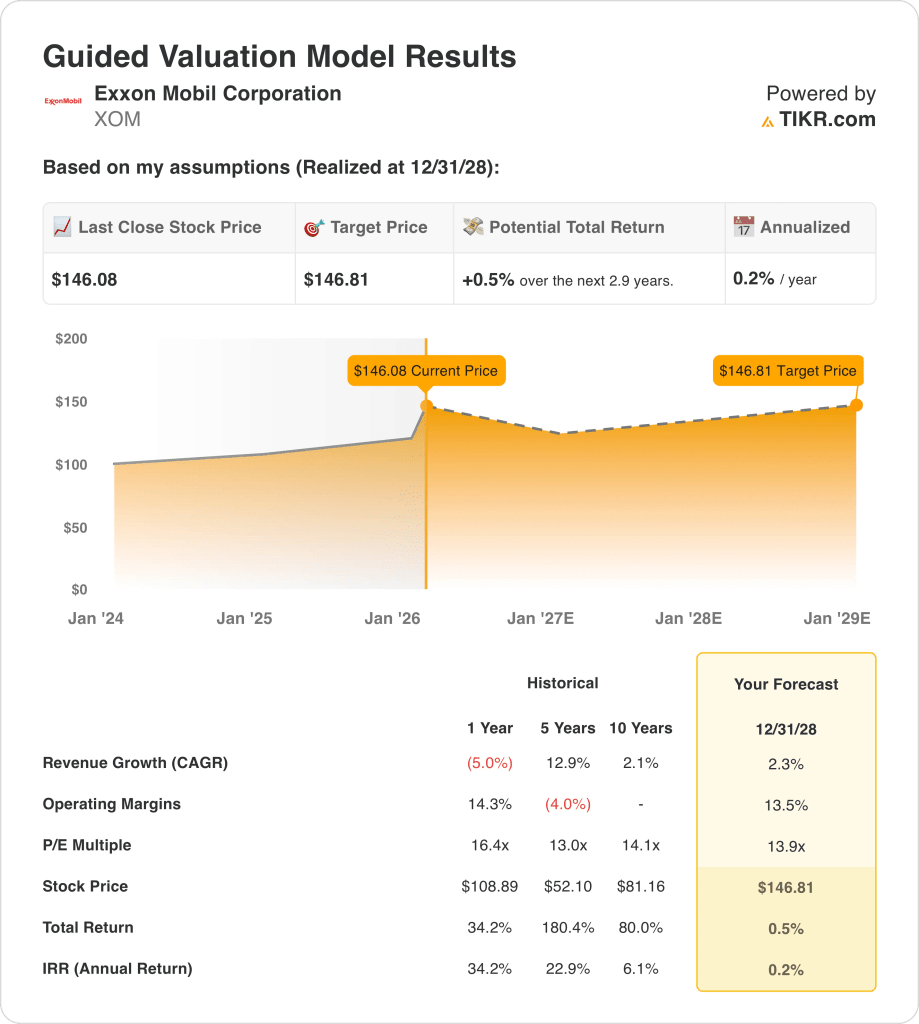
The model signals a Sell, as a 0.2% annualized return does not compensate equity risk.
At a modeled 0.2% annualized return versus a 10% equity hurdle, the valuation implies capital preservation, not appreciation, and fails to compensate equity risk, reinforcing a Sell conclusion.
Our Valuation Assumptions
TIKR’s Valuation Model lets you plug in your own assumptions for a company’s revenue growth, operating margins, and P/E multiple, and calculates the stock’s expected returns.
Here’s what we used for Exxon Mobil stock:
1. Revenue Growth: 2.3%
Exxon Mobil’s revenue base reflects a mature energy portfolio, where upstream scale and downstream exposure historically produce cyclical rather than structurally compounding growth.
Current execution supports modest expansion, with advantaged Guyana and Permian volumes offsetting weaker price realizations across refining and chemicals.
Sustaining 2.3% growth requires stable production additions and disciplined capital allocation, while commodity price softness or downstream margin pressure would quickly slow top line progress.
The 2.3% growth assumption sits below the recent 1-year pace of 5%, framing Exxon Mobil as a mature, cycle-driven business rather than a structurally expanding revenue platform.
2. Operating Margins: 13.5%
Exxon Mobil’s operating margins reflect scale advantages and integrated assets, but historical results show sensitivity to refining spreads and chemical demand cycles.
Recent results support mid-teens margins, with cost control and advantaged upstream barrels offset by weaker downstream and chemicals profitability.
Maintaining 13.5% margins requires continued execution discipline and stable operating conditions, while cost inflation or margin compression would flow rapidly into earnings.
At 13.5%, the margin assumption trails the 14.3% level achieved over the past year, reflecting expectations for normalization as downstream and chemicals temper incremental efficiency.
3. Exit P/E Multiple: 13.9x
The exit P/E multiple capitalizes terminal earnings for a mature, capital-intensive energy business with normalized growth and limited long-term re-rating expectations.
A 13.9x multiple aligns with steady earnings durability, assuming Exxon Mobil sustains scale, cost discipline, and capital returns without embedding additional margin expansion.
Execution consistency supports this multiple, but earnings volatility or weaker cash flow durability would pressure terminal valuation disproportionately.
The 13.9x exit multiple compares to a 16.4x level over the last year, embedding valuation restraint and limiting dependence on sustained multiple expansion.
What Happens If Things Go Better or Worse?
Performance for Exxon Mobil stock is driven by production execution, refining and chemical margin cycles, and expense discipline, producing multiple possible trajectories through 2030.
- Low Case: Muted upstream pricing and limited leverage keep revenue near 1.3% and margins around 9.3% → -2.1% annualized return.
- Mid Case: With core operations executing steadily, revenue growth near 1.4% and margins improving toward 9.8% → 1.7% annualized return.
- High Case: If advantaged volumes and cost control strengthen, revenue reaches 1.6% and margins approach 10.2% → 5.0% annualized return.

How Much Upside Does XOM Stock Have From Here?
With TIKR’s new Valuation Model tool, you can estimate a stock’s potential share price in under a minute.
All it takes is three simple inputs:
- Revenue Growth
- Operating Margins
- Exit P/E multiple
If you’re not sure what to enter, TIKR automatically fills in each input using analysts’ consensus estimates, giving you a quick, reliable starting point.
From there, TIKR calculates the potential share price and total returns under Bull, Base, and Bear scenarios so you can quickly see whether a stock looks undervalued or overvalued.
Looking for New Opportunities?
- See what stocks billionaire investors are buying so you can follow the smart money.
- Analyze stocks in as little as 5 minutes with TIKR’s all-in-one, easy-to-use platform.
- The more rocks you overturn… the more opportunities you’ll uncover. Search 100K+ global stocks, global top investor holdings, and more with TIKR.
Disclaimer:
Please note that the articles on TIKR are not intended to serve as investment or financial advice from TIKR or our content team, nor are they recommendations to buy or sell any stocks. We create our content based on TIKR Terminal’s investment data and analysts’ estimates. Our analysis might not include recent company news or important updates. TIKR has no position in any stocks mentioned. Thank you for reading, and happy investing!