
Key Takeaways:
- Aflac continues to generate stable cash flows from its Japan and U.S. supplemental insurance franchises, supported by strong margins and returns on equity.
- AFL stock could reasonably reach $138 per share by December 2029, based on our valuation assumptions.
- This implies a total return of 21.8% from today’s price of $114, with an annualized return of 5.2% over the next 3.9 years.
Aflac Incorporated (AFL) continues to leverage its leading positions in Japan and the United States to sell supplemental health and life insurance products while maintaining attractive profitability metrics such as a 30.0% EBIT margin and 15.6% return on equity.
The insurer benefits from a conservative balance sheet with LTM Net Debt/EBITDA of 1.40x and a 2.3% dividend yield, and it has rewarded shareholders with an 8.8% total return over the last year as the stock climbed to $113.62 near its 52-week high of $115.84.
Recent catalysts include the release of fiscal year 2025 results on February 4, 2026, and today’s 2025 earnings call, while investors are also watching the upcoming UBS Financial Services Conference appearance on February 11 and the next cash dividend of $0.61 per share scheduled for February 18, 2026.
These events, together with Aflac’s regular earnings releases through 2026, provide ongoing checkpoints for how management is navigating modest forward revenue growth of 0.4% and EPS growth of 0.7%.
Here’s why Aflac stock could provide steady but moderate returns through 2029 as it balances slow top-line growth with high margins, strong capital returns, and a valuation that already reflects much of its quality.
What the Model Says for Aflac Stock
We analyzed the upside potential for Aflac stock using valuation assumptions based on its resilient supplemental insurance business, solid profitability, and slow forecast revenue growth.
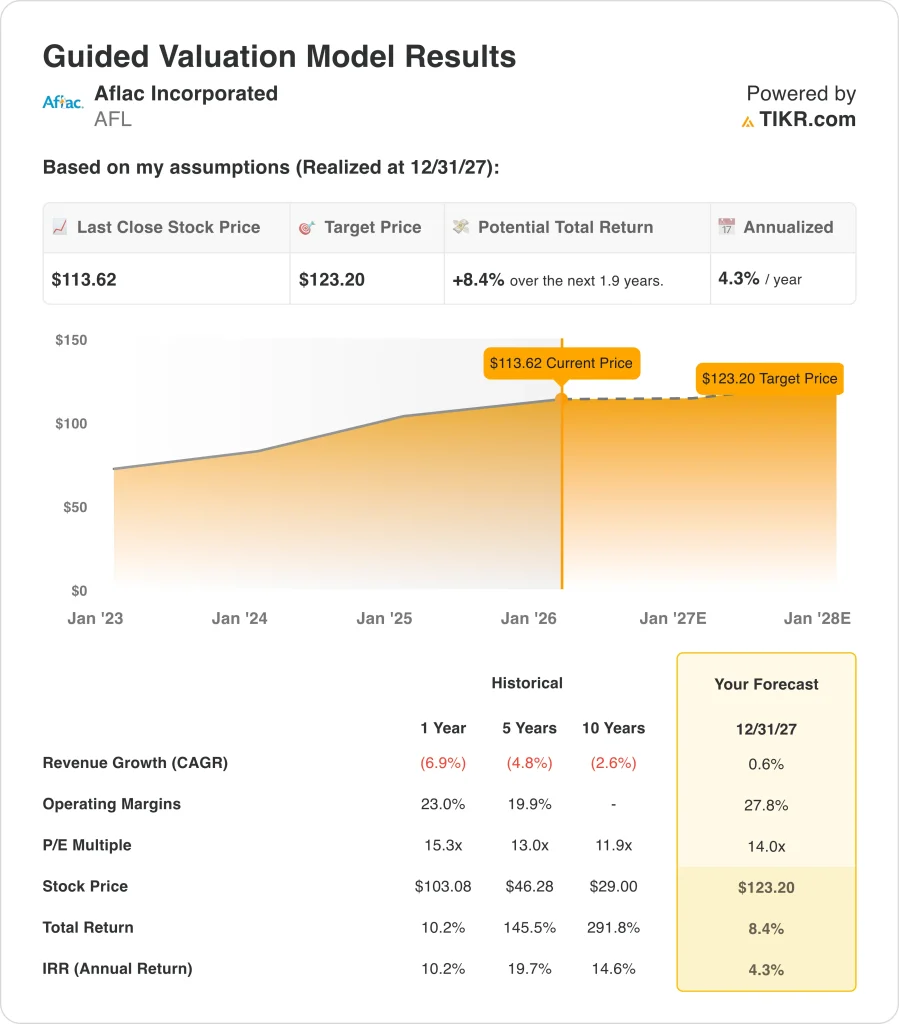
Based on estimates of 0.6% annual revenue growth, 27.8% operating margins, and a normalized P/E multiple of 14.0x, the model projects Aflac stock could rise from $114 to $123 per share by December 2027.
That would be a total return of 8.4%, or an annualized return of 4.3% over the next 1.9 years.
Our Valuation Assumptions
TIKR’s Valuation Model lets you plug in your own assumptions for a company’s revenue growth, operating margins, and P/E multiple, and calculates the stock’s expected returns.
Here’s what we used for Aflac stock:
1. Revenue Growth: 0.6%
Aflac’s historical revenue performance has been modest, with revenue down 6.9% over the last year and declining at a 2.6% CAGR over the past decade, partly reflecting currency impacts in Japan and portfolio repositioning.
However, analysts now expect very low but positive revenue growth. Based on analysts’ consensus estimates, we use a 0.6% CAGR through 2027 that aligns with the company’s Fwd 2-Year revenue CAGR of 0.4% shown in the TIKR overview.
This conservative revenue assumption acknowledges Aflac’s mature markets and limited organic growth, but it also reflects the company’s ability to sustain its premium base through product refreshes and distribution strength in Japan and the U.S. rather than meaningful expansion.
2. Operating Margins: 27.8%
Aflac’s business remains highly profitable. Based on analysts’ consensus estimates, we use an operating margin of 27.8%, which is slightly below the current 30.0% LTM EBIT margin shown in TIKR’s efficiency data.
This margin assumption reflects management’s track record of disciplined underwriting and expense control, but it also allows for some pressure from investment yields, regulatory changes, and product mix while still leaving Aflac with one of the strongest margin profiles in the insurance industry.
Because Aflac operates largely in supplemental insurance with relatively predictable claims patterns, it has historically been able to maintain attractive profitability even during macro volatility, and the model assumes this continues.
3. Exit P/E Multiple: 14.0x
Aflac stock currently trades around a next-twelve-month P/E of 15.77x and a trailing P/E of 14.80x, while we use a slightly lower 14.0x normalized exit multiple by 2027 based on analysts’ consensus estimates.
This multiple reflects the company’s durable franchise, strong returns on equity, and shareholder-friendly capital allocation, but it also incorporates the reality of slow expected growth and interest-rate sensitive earnings.
With the stock near its 52-week high and offering only 4.3% annualized returns under these assumptions, the shorter-term model suggests that much of Aflac’s quality is already reflected in the current valuation, especially after last year’s solid 10.2% total return.
Build your own Valuation Model to value any stock (It’s free!) >>>
What Happens If Things Go Better or Worse?
Different scenarios for Aflac stock through 2029 show varied outcomes based on earnings growth, margins, and valuation (these are estimates, not guaranteed returns):
- Low Case: Revenue and EPS growth slow, and valuation contracts → 6.2% annual returns
- Mid Case: Earnings grow in line with our base assumptions and the multiple holds near current levels → 11.9% annual returns
- High Case: Earnings and capital returns surprise positively and the market supports a stronger multiple → 16.9% annual returns
Even in the optimistic case, Aflac’s modeled annualized returns remain in the mid‑single digits, so the stock looks closer to fairly valued than deeply undervalued on these assumptions.

See what analysts think about AFL stock right now (Free with TIKR) >>>
How Much Upside Does Aflac Stock Have From Here?
With TIKR’s new Valuation Model tool, you can estimate a stock’s potential share price in under a minute.
All it takes is three simple inputs:
- Revenue Growth
- Operating Margins
- Exit P/E Multiple
If you’re not sure what to enter, TIKR automatically fills in each input using analysts’ consensus estimates, giving you a quick, reliable starting point.
From there, TIKR calculates the potential share price and total returns under Bull, Base, and Bear scenarios so you can quickly see whether a stock looks undervalued or overvalued.
See a stock’s true value in under 60 seconds (Free with TIKR) >>>
Looking for New Opportunities?
- See what stocks billionaire investors are buying so you can follow the smart money.
- Analyze stocks in as little as 5 minutes with TIKR’s all-in-one, easy-to-use platform.
- The more rocks you overturn… the more opportunities you’ll uncover. Search 100K+ global stocks, global top investor holdings, and more with TIKR.
Disclaimer:
Please note that the articles on TIKR are not intended to serve as investment or financial advice from TIKR or our content team, nor are they recommendations to buy or sell any stocks. We create our content based on TIKR Terminal’s investment data and analysts’ estimates. Our analysis might not include recent company news or important updates. TIKR has no position in any stocks mentioned. Thank you for reading, and happy investing!