Key Stats for CSX Corporation Stock
- Past-Week Performance: 5%
- 52-Week Range: $26 to $40
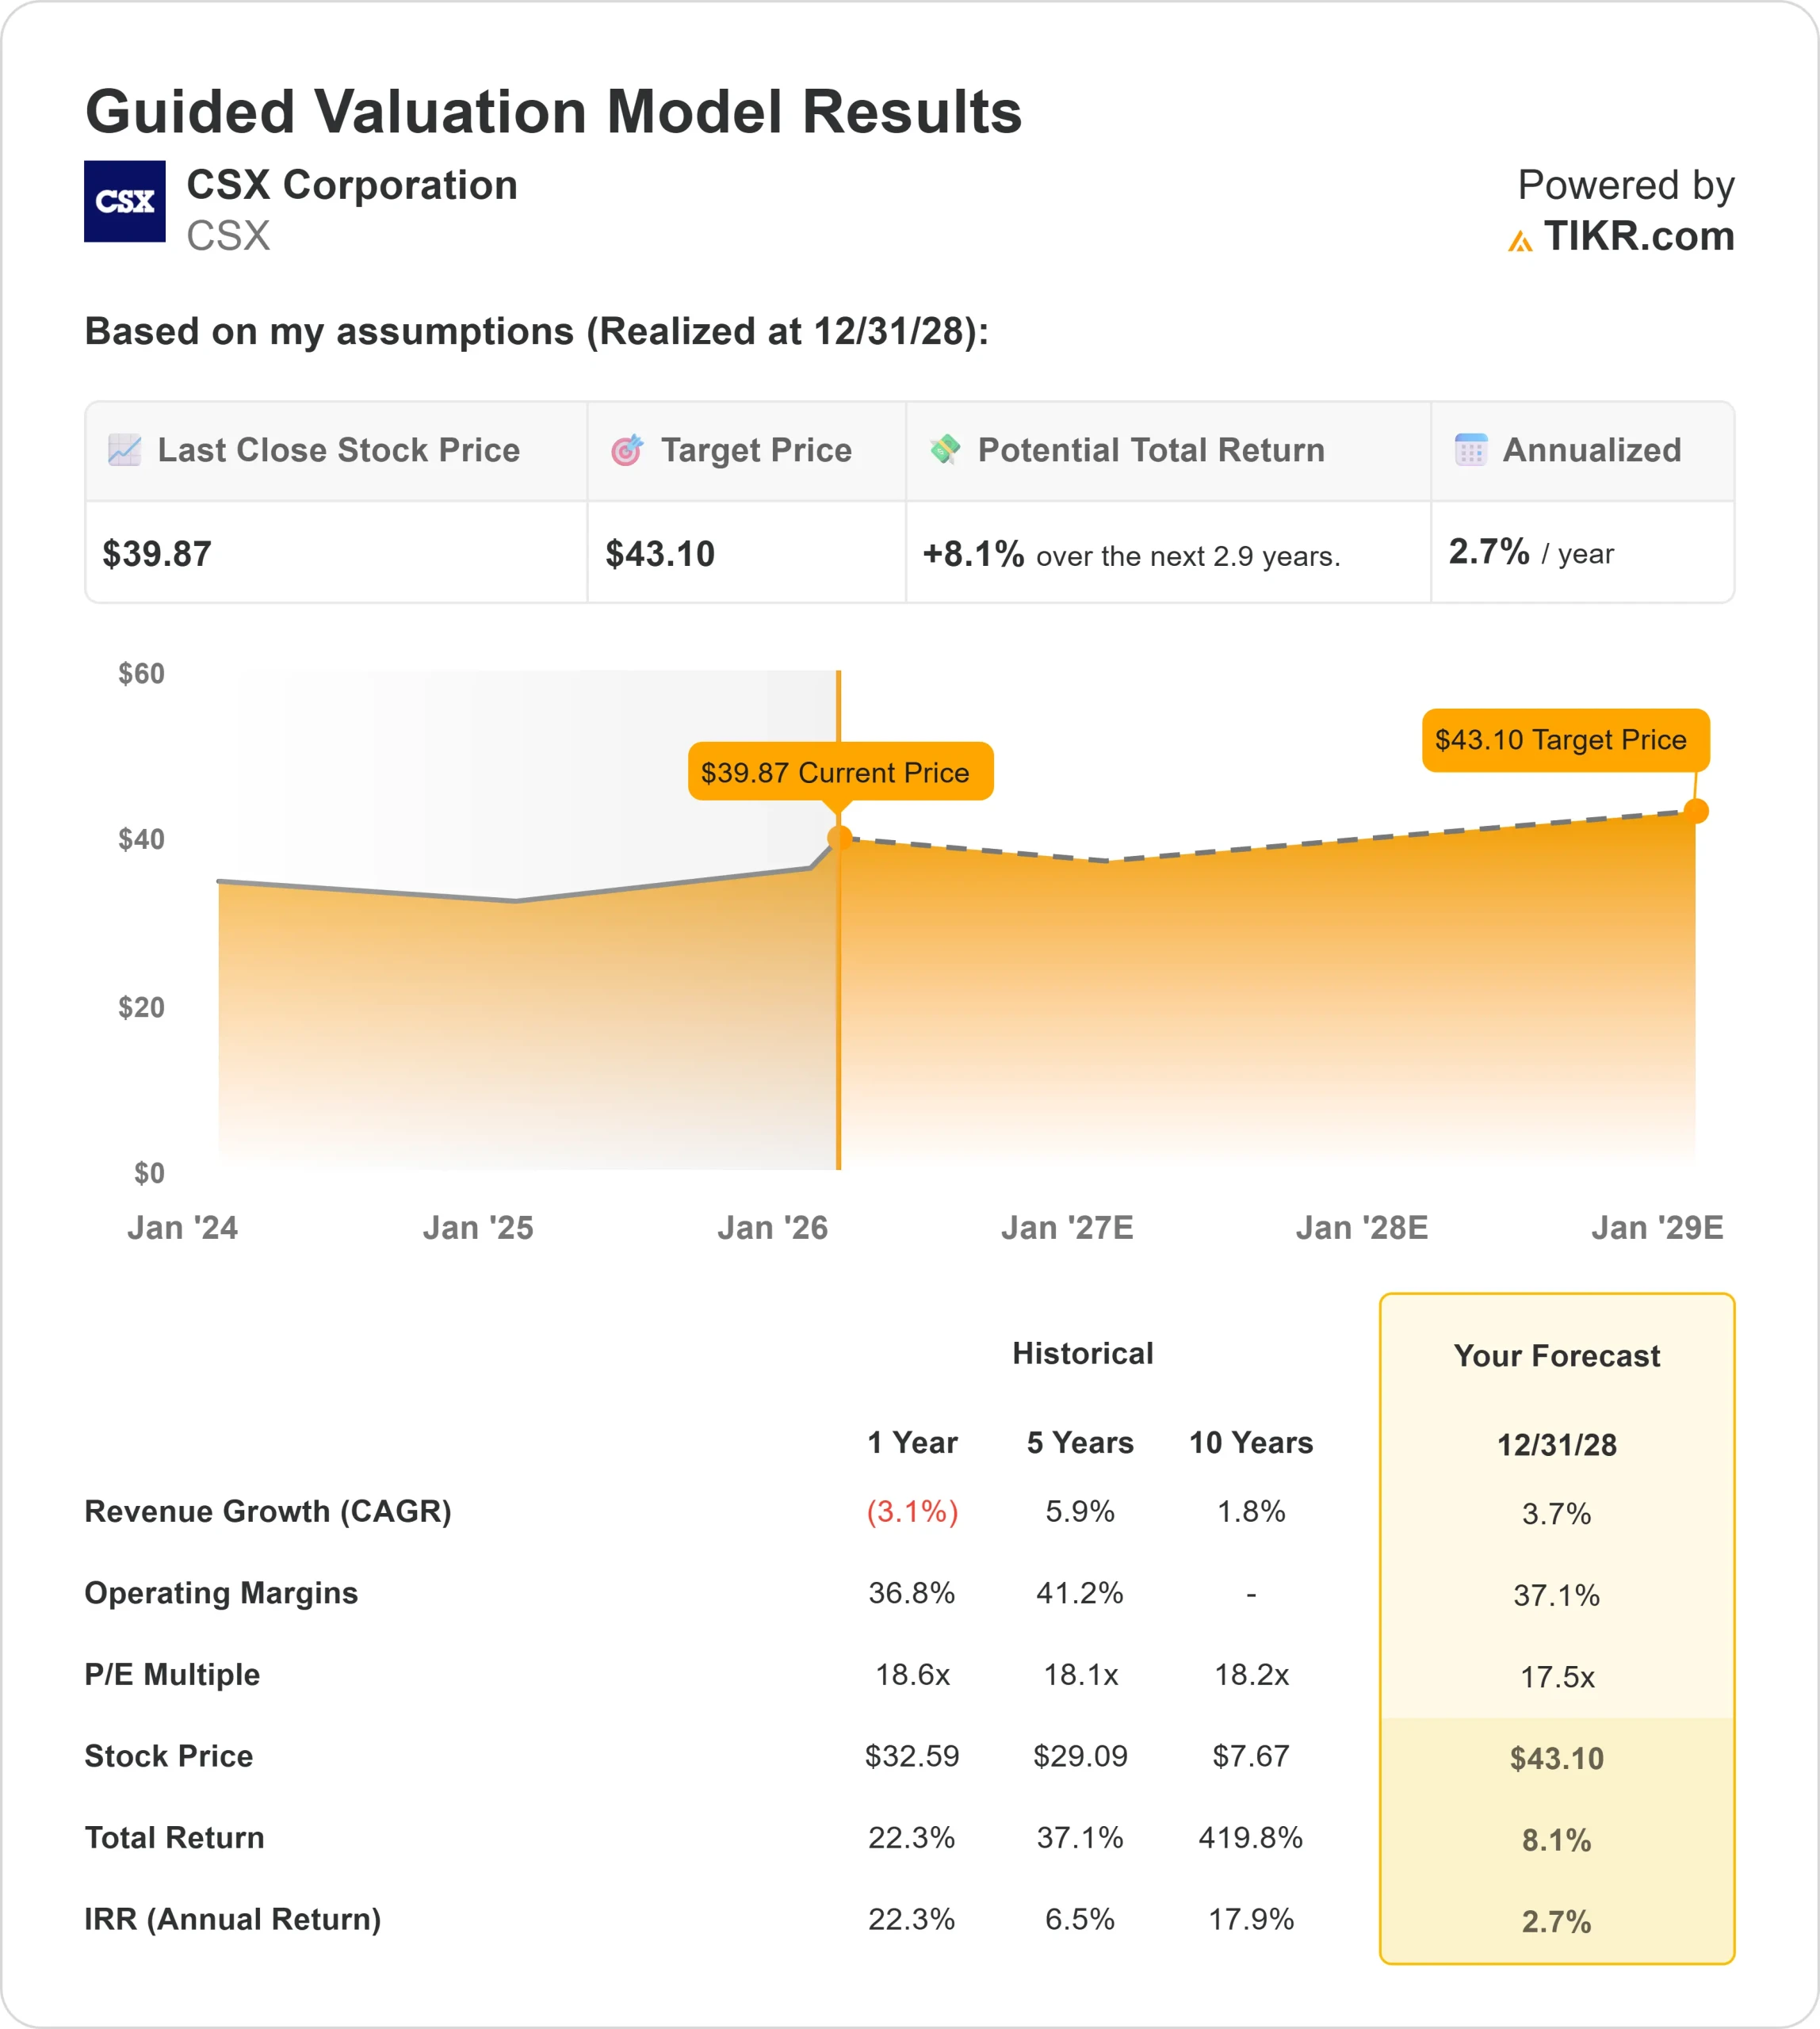
- Valuation Model Target Price: $43
- Implied Upside: 8%
Value your favorite stocks like CSX Corporation with 5 years of analysts’ forecasts using TIKR’s new Valuation Model (It’s free) >>>
What Happened?
CSX Corporation stock rose about 5% this week, trading near $38 per share and moving toward the upper end of its $26 to $40 52-week range.
The advance developed steadily through the week, pointing to follow-through buying rather than a single headline-driven spike.
Analyst price target revisions were a key driver. Rothschild & Co Redburn raised its target to $42.50 from $39 and reiterated a buy rating, implying about 12% upside, while Argus lifted its target to $42 and Raymond James raised its target to $41, both maintaining bullish ratings.
The cluster of upward revisions kept CSX in focus and reinforced confidence in the company’s earnings durability and margin profile.
This week, CSX also updated investors on its fourth quarter results. Volume increased 1%, while revenue declined 1%, with operating income and earnings per share down 9% and 7%, respectively, reflecting roughly $50 million in workforce and technology charges.
Intermodal was a standout, with revenue up 7% on 5% volume growth, and management guided to low single-digit revenue growth in 2026 alongside 200 to 300 basis points of operating margin expansion, stating that “we are assuming low single-digit revenue growth for the year.”
Institutional and insider activity added context but did not disrupt momentum. Strengthening Families & Communities LLC initiated a new stake of about 62,000 shares worth roughly $2.2 million.
While the New York State Common Retirement Fund trimmed its position by 8% but still holds more than 2.0 million shares valued near $74 million.
At the same time, CSX EVP Stephen Fortune and CAO Diana Sorfleet sold shares for portfolio and compensation-related reasons while retaining sizable holdings, with shares holding firm near highs despite the disclosures.
See analysts’ growth forecasts and price targets for CSX Corporation (It’s free) >>>
Is CSX Corporation Undervalued?

Under valuation assumptions, the stock is modeled using:
- Revenue Growth (CAGR): 3.7%
- Operating Margins: 37%
- Exit P/E Multiple: 17.5x
Revenue growth assumptions remain conservative following a soft industrial cycle, reflecting CSX’s position as a mature rail operator rather than a high-growth business.
Analyst estimates point to gradual normalization driven by intermodal expansion, infrastructure-related shipments, and steadier domestic utility coal demand rather than a sharp rebound in volumes.
That growth profile places greater emphasis on margin durability and operating leverage. CSX’s ability to sustain high operating margins through cost discipline, workforce optimization, and improved network efficiency allows incremental revenue gains to translate into earnings growth, but the overall pace remains measured in a low-growth environment.
Based on these inputs, the valuation model estimates a target price of about $43, implying roughly 8% total upside over approximately 2.9 years, or about 2.7% annually, indicating the stock appears overvalued at current levels from a total return perspective.
Results over the next year hinge on execution rather than re-rating. Intermodal remains central, supported by faster transit times, expanded network connectivity, and new lanes coming online through projects like the Howard Street Tunnel.
At the same time, margin expansion from productivity initiatives, lower capital intensity with 2026 CapEx planned below $2.4 billion, and stronger free cash flow generation support earnings stability.
At current prices, CSX appears overvalued, with future returns likely driven by operational consistency rather than meaningful upside from valuation expansion.
Estimate a company’s fair value instantly (Free with TIKR) >>>
Value Any Stock in Under 60 Seconds (It’s Free)
With TIKR’s new Valuation Model tool, you can estimate a stock’s potential share price in under a minute.
All it takes is three simple inputs:
- Revenue Growth
- Operating Margins
- Exit P/E Multiple
From there, TIKR calculates the potential share price and total returns under Bull, Base, and Bear scenarios so you can quickly see whether a stock looks undervalued or overvalued.
If you’re not sure what to enter, TIKR automatically fills in each input using analysts’ consensus estimates, giving you a quick, reliable starting point.
See a stock’s true value in under 60 seconds (Free with TIKR) >>>