Key Takeaways:
- Frontier-Led Scale Shift: Verizon is integrating Frontier to expand fiber passings beyond 30 million toward 50 million long-term target, supporting convergence-driven growth alongside $1 billion of expected run-rate cost synergies by 2028.
- Earnings Reset Execution: VVerizon stock’s $5 billion 2026 OpEx cuts and 750,000 postpaid net add target signal a pivot toward volume growth after margins fell to 21%.
- Model-Based Price Target: Based on 2% revenue growth, 24% operating margins, and an 8.6x exit P/E, VZ stock could reach $60 by December 2028.
- Upside and Returns: From the current price of $47, Verizon’s $60 target implies 28% total upside and an 9% annualized return over the next 3 years, driven by free cash flow near $21 billion and disciplined capital returns.
Verizon (VZ) generates revenue by selling wireless service, broadband connectivity, and device solutions to consumers, enterprises, and government customers across mobility and fixed access offerings at national scale.
In 2025, Verizon delivered $138 billion of revenue and $81 billion of gross profit, while $52 billion of operating expenses compressed operating income to $29 billion and a 21% operating margin.
Despite revenue stability between $134 billion and $138 billion over five years, operating margins declined from 27% in 2021 to 21% in 2025, reflecting sustained competitive pressure and accumulated cost layers.
Management has framed the reset explicitly, with CEO Dan Schulman stating, “We are building an in-year war chest of $5 billion in OpEx savings,” alongside targets for 750,000 to 1 million postpaid net adds and expanded fiber scale following the Frontier acquisition.
With Verizon trading near 9x earnings against an 8.6x modeled exit multiple, the valuation debate centers on whether 2% revenue growth and margin recovery toward 24% can restore earnings durability without re-rating support.
What the Model Says for VZ Stock
VZ stock’s capital intensive network, mature wireless market, and stable cash flows constrain growth expectations despite operational scale.
However, the model assumes 2% revenue growth, 24% margins, and a 9x exit multiple, producing a $60 target.
Therefore, the modeled 28% total upside and 9% annualized return offer limited compensation relative to equity risk.
The model signals a Sell, with a 9% annualized return below typical equity hurdle rates, indicating inadequate risk-adjusted compensation at the current valuation.

With a modeled 9% annualized return below a typical 10% equity hurdle, the valuation prioritizes capital preservation over appreciation, indicating the expected risk adjusted compensation is insufficient, justifying a Sell based on disciplined valuation logic.
Our Valuation Assumptions
TIKR’s Valuation Model lets you plug in your own assumptions for a company’s revenue growth, operating margins, and P/E multiple, and calculates the stock’s expected returns.
Here’s what we used for VZ stock:
1. Revenue Growth: 2.2%
VZ stock’s revenue has remained largely stable between $134B and $138B over the past 5 years, reflecting a mature U.S. telecom market where wireless penetration is high and incremental growth depends on mix rather than subscriber expansion.
The 2.2% revenue growth assumption is supported by management guidance for 2% to 3% service revenue growth, driven by 750,000 to 1 million postpaid net adds and continued fixed wireless and fiber additions.
This outcome depends on Verizon sustaining volume gains without renewed price increases, while higher promotions, slower churn improvement, or competitive responses could quickly pressure service revenue growth below plan.
According to consensus analyst estimates this is below the 1-year historical revenue growth of 2.5%, indicating the model assumes modest durability rather than acceleration, with limited tolerance for execution slippage before returns weaken.
2. Operating Margins: 24.2%
Verizon stock’s operating margin declined from 27% in 2021 to 21% in 2025 as competitive intensity increased and operating expenses rose despite relatively flat revenue.
The 24.2% operating margin assumption reflects $5B of planned OpEx reductions, Frontier integration synergies, and a lower capex envelope of $16B to $17B as major network builds approach completion.
Margin expansion requires sustained cost control while reinvesting in customer experience, and any delay in synergies, higher retention spending, or renewed pricing pressure would compress earnings quickly.
Based on street consensus estimates this is above the 1-year historical operating margin of 21.3%, indicating the model assumes meaningful efficiency recovery that leaves little room for cost overruns before valuation support erodes.
3. Exit P/E Multiple: 8.6x
VZ stock has historically traded near a 9x P/E as a mature telecom with steady cash flows, high leverage, and limited structural growth.
The 8.6x exit multiple capitalizes normalized earnings after margin recovery, embedding no re-rating and assuming the business remains valued primarily for durability rather than growth.
This multiple depends on earnings stability and balance sheet discipline, since slower growth, higher leverage, or execution misses would likely pressure terminal valuation rather than expand it.
In line with analyst consensus projections this is below the 1-year historical P/E of 9.0x, indicating the model assumes mild valuation compression consistent with a mature business where downside activates faster than upside.
What Happens If Things Go Better or Worse?
Verizon stock outcomes depend on wireless subscriber momentum, broadband penetration, and cost discipline, setting up a range of execution-driven paths through 2030.
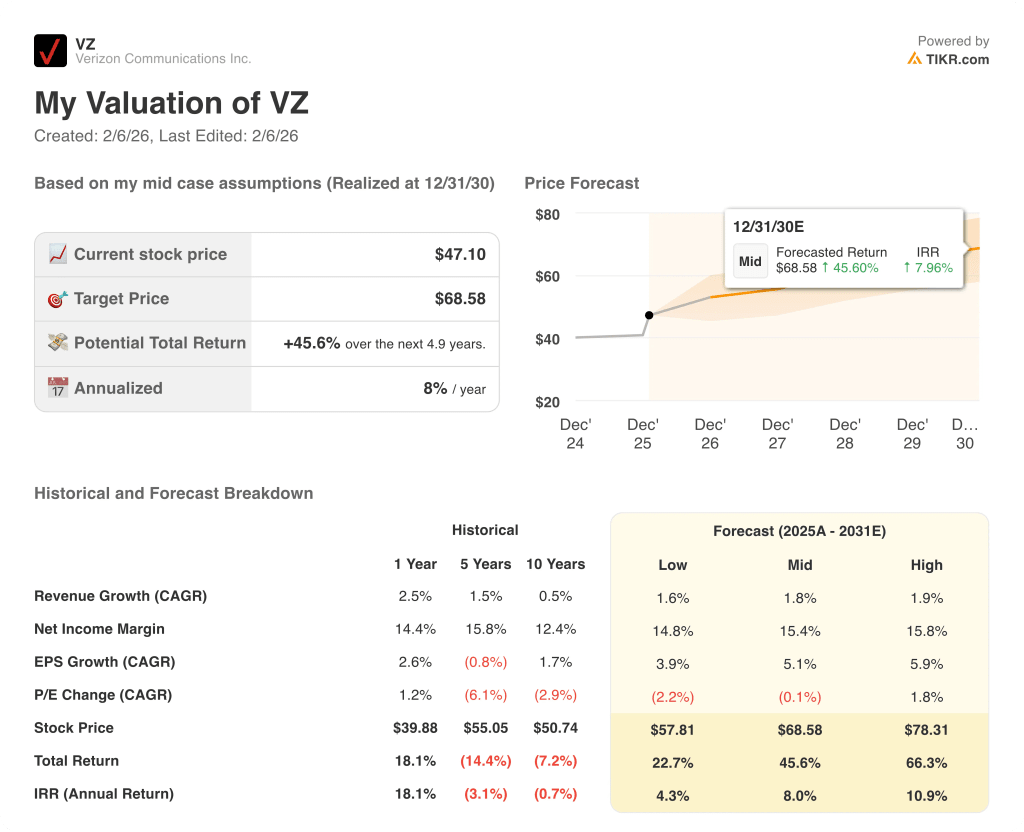
- Low Case: If wireless competition stays intense and cost savings lag, revenue grows around 1.6% and margins stay near 14.8% → 4.3% annualized return.
- Mid Case: With core wireless stabilization and steady fiber execution, revenue growth near 1.8% and margins improving toward 15.4% → 8.0% annualized return.
- High Case: If convergence traction strengthens and cost controls hold, revenue reaches about 1.9% and margins approach 15.8% → 10.9% annualized return.
How Much Upside Does Verizon Stock Have From Here?
With TIKR’s new Valuation Model tool, you can estimate a stock’s potential share price in under a minute.
All it takes is three simple inputs:
- Revenue Growth
- Operating Margins
- Exit P/E multiple
If you’re not sure what to enter, TIKR automatically fills in each input using analysts’ consensus estimates, giving you a quick, reliable starting point.
From there, TIKR calculates the potential share price and total returns under Bull, Base, and Bear scenarios so you can quickly see whether a stock looks undervalued or overvalued.
Looking for New Opportunities?
- See what stocks billionaire investors are buying so you can follow the smart money.
- Analyze stocks in as little as 5 minutes with TIKR’s all-in-one, easy-to-use platform.
- The more rocks you overturn… the more opportunities you’ll uncover. Search 100K+ global stocks, global top investor holdings, and more with TIKR.
Disclaimer:
Please note that the articles on TIKR are not intended to serve as investment or financial advice from TIKR or our content team, nor are they recommendations to buy or sell any stocks. We create our content based on TIKR Terminal’s investment data and analysts’ estimates. Our analysis might not include recent company news or important updates. TIKR has no position in any stocks mentioned. Thank you for reading, and happy investing!