

Key Takeaways:
- EOG Resources is a major U.S. shale producer with strong margins, disciplined capital allocation, and consistent shareholder returns.
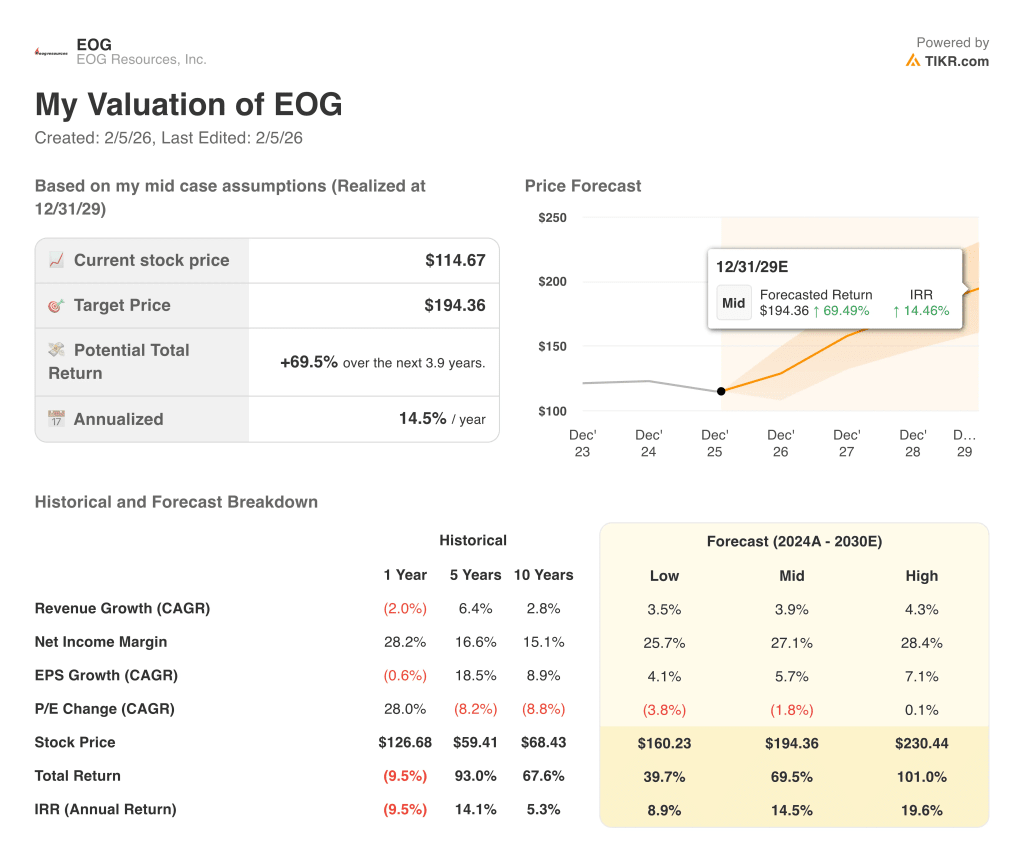
- EOG stock could reasonably reach $194 per share by December 2029, based on our valuation assumptions.
- This implies a total return of 69.5% from today’s price of $115, with an annualized return of 14.5% over the next 3.9 years.
EOG Resources (EOG) is one of the largest independent oil and gas producers in North America and continues to focus on high-return shale assets in the U.S. and Trinidad and Tobago. The company combines low leverage, strong profitability, and regular dividends, so investors often view it as a quality way to gain exposure to oil prices.
EOG generated a 5‑year total return of 93% and a 10‑year total return of 67.6%, which highlights how its disciplined strategy has rewarded long-term shareholders despite commodity volatility.
Here’s why EOG stock could provide solid returns through 2029 as it maintains capital discipline, manages a strong balance sheet, and continues returning cash to shareholders while navigating a slower growth outlook.
What the Model Says for EOG Resources Stock
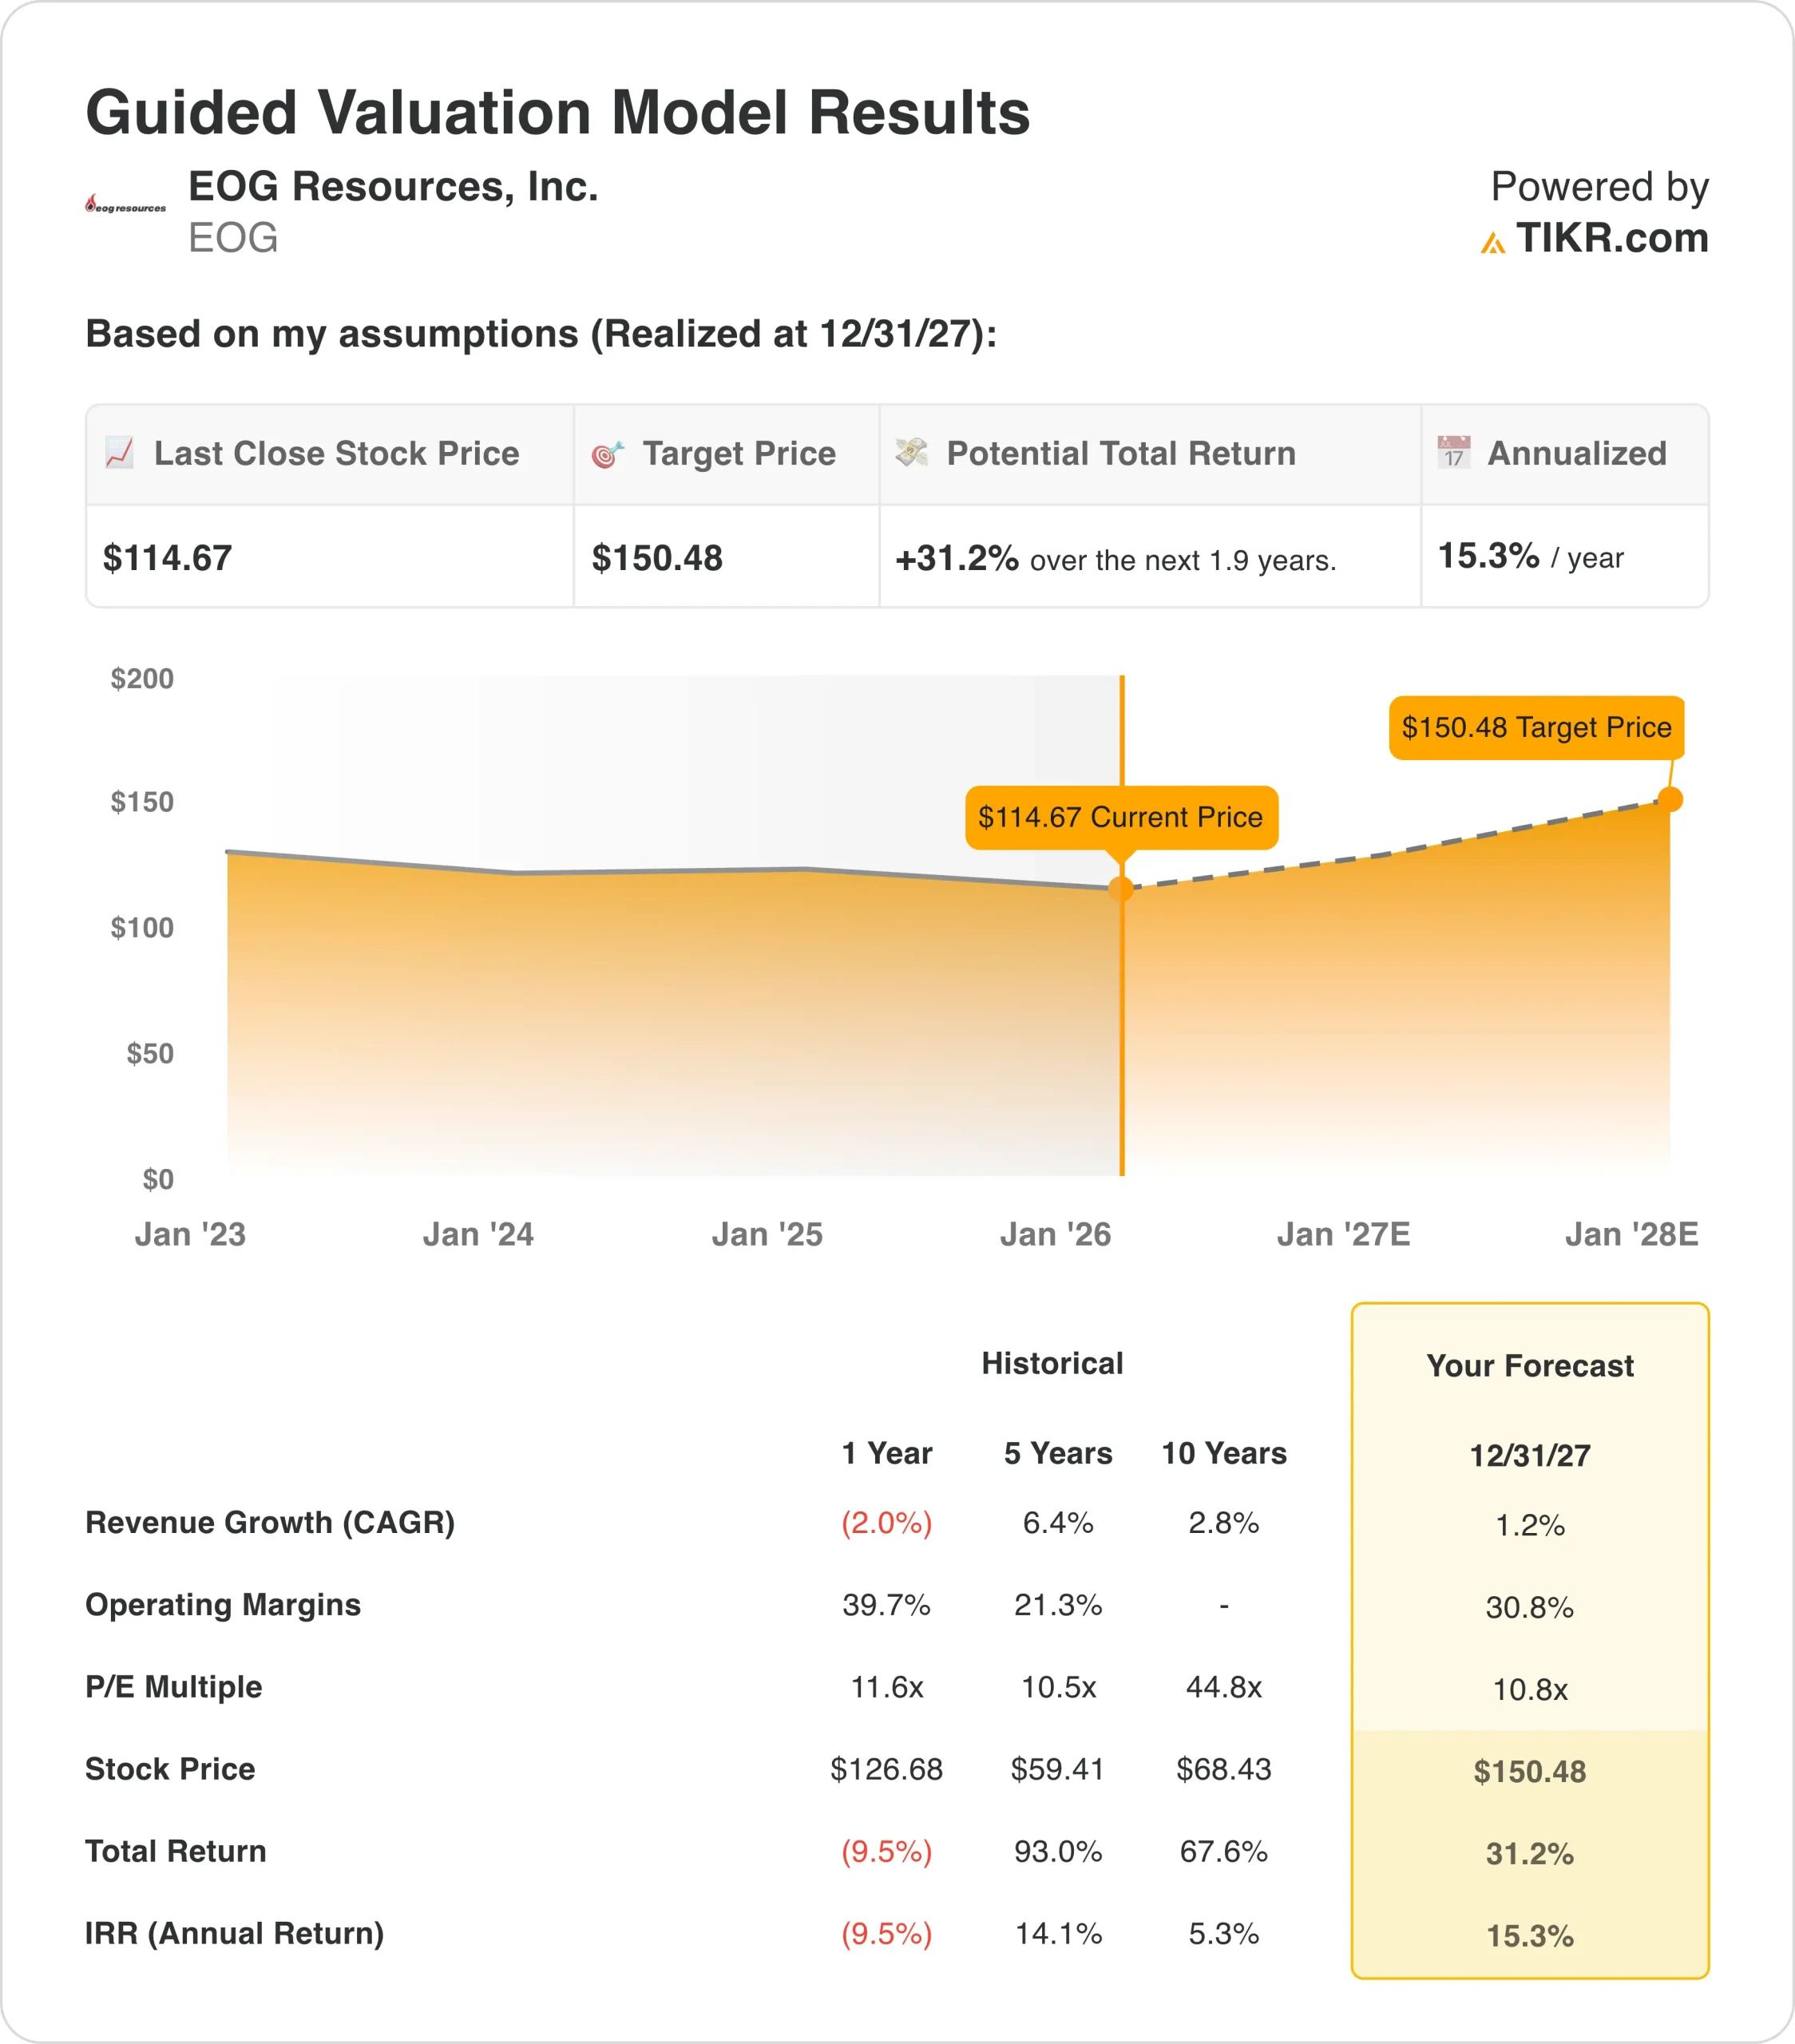
We analyzed the upside potential for EOG stock using valuation assumptions based on its historical profitability, moderate growth outlook, and current trading multiples from the TIKR Terminal and our guided model.
Based on estimates of 1.2% annual revenue growth, 30.8% operating margins, and a normalized P/E multiple of 10.8x, the guided model projects EOG stock could rise from $115 to $150 per share by December 2027.
That would be a 31.2% total return, or a 15.3% annualized return over the next 1.9 years
Our Valuation Assumptions
TIKR’s Valuation Model lets you plug in your own assumptions for a company’s revenue growth, operating margins, and P/E multiple, and calculates the stock’s expected returns.
Here’s what we used for EOG Resources stock:
1. Revenue Growth: 1.2%
Based on analysts’ consensus estimates, we use a 1.2% revenue CAGR through December 2027, which is modest compared with its last three‑year revenue CAGR of 8.3%.
Forward two‑year revenue estimates in the TIKR Terminal currently point to a negative 2.2% CAGR, so the model’s growth input sits slightly above those cautious forecasts. This difference reflects how analysts expect near‑term revenue pressure from softer commodity price assumptions and slower volume growth, even though EOG has delivered positive long‑term expansion.
The company’s 1‑year revenue contraction of about 2% also shows how short‑term swings in oil and gas prices can affect top‑line results, but the broader five‑year CAGR of 6.4% highlights resilience over a full cycle.
Based on this backdrop, a 1.2% revenue growth assumption sits between recent declines and longer‑term history, so it provides a conservative yet positive outlook within the model’s time frame.
2. Operating Margins: 30.8%
EOG’s last twelve months EBIT margin is 31.6%, and the guided valuation assumes operating margins of 30.8% by 2027, which is very close to this recent level.
The company posted a 39.7% operating margin over the last year in the historical model view, and its five‑year margin sits above 20%, so profitability has remained strong even as commodity prices fluctuated.
Efficiency metrics such as 62.3% gross margin, 18.5% ROE, and 15.8% ROIC support the idea that EOG has a structurally efficient asset base and disciplined cost control.
Because the company also maintains low leverage with net debt to EBITDA of only 0.36x, operating performance does not rely heavily on financial engineering, which can be important in cyclical resource sectors.
Therefore, using a 30.8% operating margin in the model appears consistent with both historical performance and current profitability, without assuming further expansion.
3. Exit P/E Multiple: 10.8x
EOG stock currently trades at a next‑twelve‑month P/E multiple of 12.57x, and the model assumes an exit P/E of 10.8x. This exit multiple is slightly below the current level and also below the 11.41x last twelve months P/E, which builds in some room for potential multiple compression rather than expansion.
The stock’s valuation sits within a reasonable band relative to its quality metrics and dividend yield of 3.6%, so a 10.8x exit P/E can be seen as a conservative normalization rather than a best‑case scenario.
Because the model still indicates low‑ to mid‑teens annualized returns even with this lower multiple, most of the expected performance comes from earnings and cash generation rather than from multiple re‑rating.
In other words, under these assumptions, EOG’s return potential is tied more to sustained profitability and shareholder distributions than to the market assigning a higher valuation.
Build your own Valuation Model to value any stock (It’s free!) >>>
What Happens If Things Go Better or Worse?
Different scenarios for EOG stock through 2030 show varied outcomes based on changes in revenue growth, margins, and valuation multiples in the model (these are estimates, not guaranteed returns):
- Low Case: Revenue growth of 3.5%, lower margins of 25.7%, and a P/E change of negative 3.8% per year → 6.2% annual returns
- Mid Case: 3.9% revenue growth, 27.1% net income margin, and P/E compression of 1.8% per year → 11.9% annual returns
- High Case: 4.3% revenue growth, 28.4% margins, and flat P/E multiples → 16.9% annual returns
Even in the conservative low case, EOG stock generates returns near the high single‑digit range in the model, supported by its strong profitability, modest leverage, and ongoing cash returns via dividends.
The mid and high cases both exceed 10% annualized returns, with the high case surpassing 15%, which would place EOG among more interesting opportunities under these particular assumptions.
See what analysts think about EOG stock right now (Free with TIKR) >>>
How Much Upside Does EOG Resources Stock Have From Here?
With TIKR’s new Valuation Model tool, you can estimate a stock’s potential share price in under a minute.
All it takes is three simple inputs:
- Revenue Growth
- Operating Margins
- Exit P/E Multiple
If you’re not sure what to enter, TIKR automatically fills in each input using analysts’ consensus estimates, giving you a quick, reliable starting point.
From there, TIKR calculates the potential share price and total returns under Bull, Base, and Bear scenarios so you can quickly see whether a stock looks undervalued or overvalued.
See a stock’s true value in under 60 seconds (Free with TIKR) >>>
Looking for New Opportunities?
- See what stocks billionaire investors are buying so you can follow the smart money.
- Analyze stocks in as little as 5 minutes with TIKR’s all-in-one, easy-to-use platform.
- The more rocks you overturn… the more opportunities you’ll uncover. Search 100K+ global stocks, global top investor holdings, and more with TIKR.
Disclaimer:
Please note that the articles on TIKR are not intended to serve as investment or financial advice from TIKR or our content team, nor are they recommendations to buy or sell any stocks. We create our content based on TIKR Terminal’s investment data and analysts’ estimates. Our analysis might not include recent company news or important updates. TIKR has no position in any stocks mentioned. Thank you for reading, and happy investing!


