Key Takeaways:
- Earnings Normalization: Charles Schwab stock reflects a post-balance-sheet reset phase, with operating margins expanding toward 53% as funding costs normalize and scale efficiencies reassert.
- Execution Momentum: Charles Schwab stock benefits from record client engagement, supporting 8% modeled revenue growth through 2028 despite moderating market-driven activity.
- Price Target Path: Based on normalized profitability and a 17x exit multiple, Charles Schwab stock carries a $157 price target by December 2028.
- Return Profile: From a $102 current price, Charles Schwab stock implies 54% total upside and a 16% annualized return under the modeled valuation path.
The Charles Schwab Corporation (SCHW) generates revenue from brokerage, asset management, advisory, and banking services, serving more than 46 million client accounts across retail and registered investment advisers.
In 2025, Charles Schwab produced $24 billion in revenue and expanded operating margins toward 50%, reflecting improved net interest income, strong trading activity, and controlled expense growth across a scaled platform.
Client engagement remained elevated, as Charles Schwab attracted $519 billion in net new assets and supported over 2 billion trades, reinforcing its position as the largest custodian and retail brokerage franchise by assets.
Management framed 2026 as an execution-driven year, with CEO Rick Wurster stating, “We are entering 2026 in a leading competitive position and our momentum is strong.”
While the model assumes 8% revenue growth and 53% operating margins by 2028, Charles Schwab stock now trades against expectations of sustained normalization rather than cyclical recovery, setting up a debate around durability versus valuation.
What the Model Says for Schwab Stock
Overall, Charles Schwab’s scaled brokerage franchise and asset-heavy balance sheet support elevated profitability, while capital intensity and rate sensitivity constrain long-term growth expectations.
However, the model assumes 8.4% revenue growth, 52.6% operating margins, and a 17.4x exit multiple, producing a $157 target price by 2028.
Therefore, the modeled 54% total upside and 16% annualized return exceed opportunity-cost thresholds, offering compensation consistent with Schwab’s earnings durability and balance sheet risk.

The model signals a Buy, as a 16% annualized return surpasses equity hurdle requirements, indicating sufficient risk-adjusted compensation under disciplined capital allocation logic.
With a modeled 16% annualized return exceeding a typical 10% equity hurdle, the valuation supports capital appreciation rather than preservation, indicating returns adequately compensate for balance sheet risk and execution demands, justifying a Buy under disciplined valuation logic.
Our Valuation Assumptions
TIKR’s Valuation Model lets you plug in your own assumptions for a company’s revenue growth, operating margins, and P/E multiple, and calculates the stock’s expected returns.
Here’s what we used for Charles Schwab stock:
1. Revenue Growth: 8.4%
Charles Schwab stock’s historical revenue expansion reflects asset gathering, rate sensitivity, and trading activity, positioning growth expectations around cycle normalization rather than structural acceleration.
Current execution is supported by strong net new assets, record client accounts, and diversified revenue streams across brokerage, banking, and asset management.
Sustaining 8.4% growth requires stable markets, continued asset inflows, and steady client engagement, while rate compression or trading normalization would pressure revenue momentum.
According to consensus analyst estimates, this is below the 1-year historical revenue growth of 22%, indicating the model assumes maturity-driven deceleration where any asset flow shortfall quickly weakens returns.
2. Operating Margins: 52.6%
Schwab stock’s margin profile has historically reflected scale economics, interest income leverage, and disciplined expense control across a large fixed-cost infrastructure.
Current performance benefits from higher net interest revenue, efficiency gains, and operating leverage as revenue growth outpaces expense growth.
Maintaining 52.6% margins depends on rate stability, funding normalization, and continued cost discipline, while margin lending slowdown or higher service costs would erode profitability.
Based on street consensus estimates, this is above the 1-year historical operating margin of 39%, indicating the model assumes sustained efficiency where any cost slippage compresses valuation quickly.
3. Exit P/E Multiple: 17.4x
The exit multiple reflects Schwab stock’s mature brokerage franchise, recurring earnings base, and lower long-term growth profile relative to fintech or asset-light peers.
The model capitalizes normalized net income after embedding margin expansion and balance sheet repair, avoiding overlap with operational optimism already assumed.
Execution must deliver durable earnings and capital discipline to support a 17.4x multiple, while earnings volatility or rate-driven pressure invites multiple compression.
In line with analyst consensus projections, this is below the 1-year historical P/E of 19x, indicating the model assumes valuation normalization with limited re-rating potential if execution falters.
What Happens If Things Go Better or Worse?
Charles Schwab stock outcomes depend on asset inflows, interest rate sensitivity, trading activity, and expense discipline, setting up a range of possible paths through 2030.
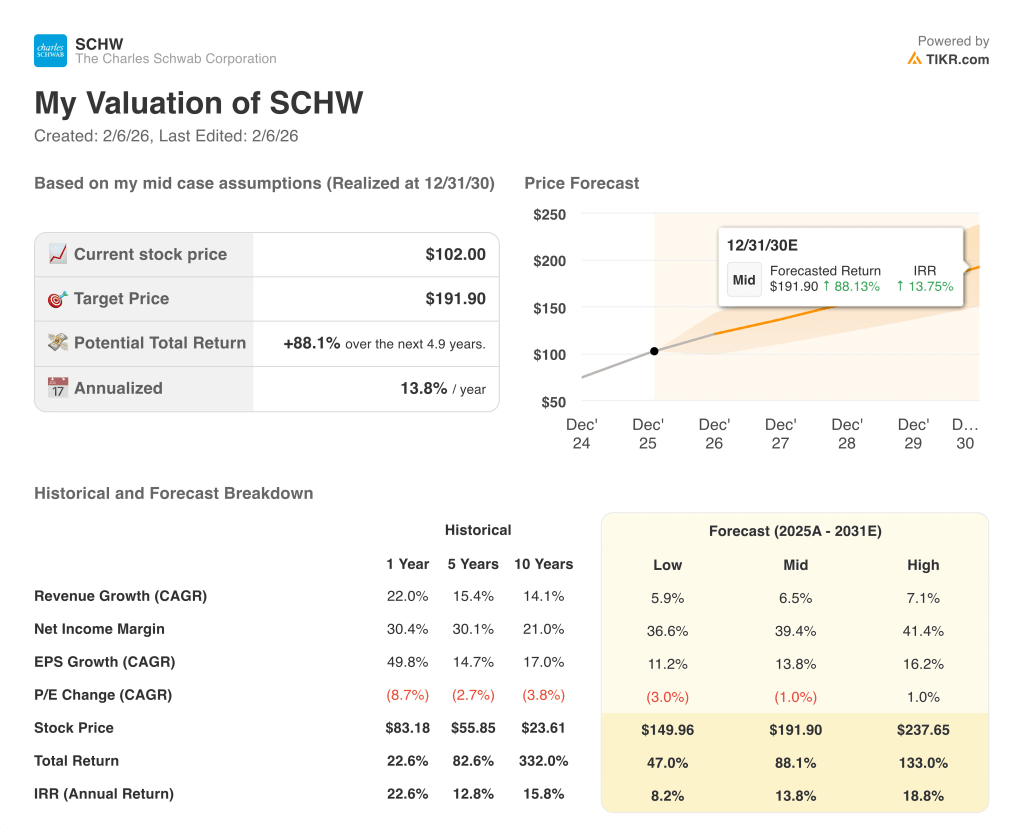
- Low Case: If rate pressure persists and trading activity cools, revenue grows around 5.9% and margins stay near 36.6% → 8.2% annualized return.
- Mid Case: With asset gathering and balance sheet normalization holding, revenue growth near 6.5% and margins improving toward 39.4% → 13.8% annualized return.
- High Case: If client engagement accelerates and rate headwinds fade, revenue reaches about 7.1% and margins approach 41.4% → 18.8% annualized return.
How Much Upside Does It Have From Here?
With TIKR’s new Valuation Model tool, you can estimate a stock’s potential share price in under a minute.
All it takes is three simple inputs:
- Revenue Growth
- Operating Margins
- Exit P/E multiple
If you’re not sure what to enter, TIKR automatically fills in each input using analysts’ consensus estimates, giving you a quick, reliable starting point.
From there, TIKR calculates the potential share price and total returns under Bull, Base, and Bear scenarios so you can quickly see whether a stock looks undervalued or overvalued.
Looking for New Opportunities?
- See what stocks billionaire investors are buying so you can follow the smart money.
- Analyze stocks in as little as 5 minutes with TIKR’s all-in-one, easy-to-use platform.
- The more rocks you overturn… the more opportunities you’ll uncover. Search 100K+ global stocks, global top investor holdings, and more with TIKR.
Disclaimer:
Please note that the articles on TIKR are not intended to serve as investment or financial advice from TIKR or our content team, nor are they recommendations to buy or sell any stocks. We create our content based on TIKR Terminal’s investment data and analysts’ estimates. Our analysis might not include recent company news or important updates. TIKR has no position in any stocks mentioned. Thank you for reading, and happy investing!