
Key Takeaways:
- Backlog Scale: General Electric Co. ended 2025 with a $190 billion backlog, giving the business multi-year revenue visibility as airlines keep engines flying and shop-visit demand stays tight.
- Services Momentum: General Electric stock grew 2025 revenue 21% and increased operating profit by $2 billion, driven by commercial services strength, higher commercial and defense deliveries, and management’s expectation that LEAP original equipment turns profitable in 2026.
- Price Target Path: Based on 11% revenue growth, 22% operating margins, and a 39x exit multiple, GE stock could reach $427 by December 2028.
- Modeled Upside: From the current price of $321, GE Aerospace implies 33% total upside to $427 over the next 3 years which equates to a 10% annualized return.
General Electric Company, doing business as GE Aerospace (GE) sells commercial and defense jet engines and earns recurring service revenue from maintenance events, spare parts, and long-life engine support across 2 segments serving airlines, airframers, and governments.
In 2025, General Electric generated $46 billion of revenue, $14 billion of gross profit, $5 billion of operating expenses, and $9 billion of operating income, translating into a 21% operating margin that reflects strong service mix.
Management framed 2026 around sustained growth and cash conversion, with Larry Culp stating, “We expect operating profit of $9.85 billion to $10.25 billion,” anchoring expectations for another step-up year.
Organizational changes announced in January 2026 expand CES to include technology and operations and shift $1 billion of revenue into DPT, intended to improve end-to-end engine life-cycle execution and reduce turnaround times as volumes rise.
With the stock implying a 39x multiple and the model pointing to $427 versus $321 today, the debate centers on whether a 21% margin base can persist as delivery ramp complexity increases.
What the Model Says for General Electric Stock
General Electric stock’s strong service backlog supports earnings durability, though capital intensity and delivery complexity elevate operational expectations.
However, the valuation model applies 10.7% revenue growth, 22.4% operating margins, and a 39.4x exit multiple, producing a $427.22 target price.
Therefore, the modeled 33.1% total upside and 10.4% annualized return slightly surpass typical equity opportunity costs.

Notably, the model signals a Buy for General Electric Stock. as expected returns clear hurdle rates and valuation rests on sustained execution rather than multiple expansion.
At a modeled 10.4% annualized return exceeding a standard 10% equity hurdle, the valuation offers sufficient risk-adjusted compensation, favoring capital appreciation over preservation and supporting a Buy grounded in disciplined capital allocation logic.
Our Valuation Assumptions
TIKR’s Valuation Model lets you plug in your own assumptions for a company’s revenue growth, operating margins, and P/E multiple, and calculates the stock’s expected returns.
Here’s what we used for GE stock:
1. Revenue Growth: 10.7%
Over the past year, General Electric stock generated 21% revenue growth, reflecting a sharp rebound driven by commercial services volume, higher shop visits, and defense deliveries.
Current performance is supported by a $190 billion backlog, mid-teens commercial services growth, and management guidance for low double-digit company revenue growth in 2026.
Sustaining this pace requires continued airline utilization, supplier throughput improvements, and stable defense demand, while any material supply chain slippage or OEM delivery delays would slow revenue realization.
According to consensus analyst estimates, revenue downside would quickly pressure valuation because growth assumptions compound with margins, weakening returns before cost flexibility offsets volume shortfalls.
This sits below the 1-Year historical revenue growth of 21%, signaling the model assumes demand normalizes as aftermarket volumes stabilize and defense deliveries level off rather than sustaining rebound-driven acceleration.
2. Operating Margins: 22.4%
General Electric stock expanded operating margins to 21% last year as commercial services mix improved and fixed costs were absorbed across higher volumes.
Management expects further margin support from aftermarket scale, disciplined cost control, and operating profit of $10 billion in 2026.
Margin durability depends on services pricing, spare parts availability, and controlled reinvestment, while higher OE mix or execution friction would cap incremental profitability.
In line with analyst consensus projections, modest margin slippage would erode returns quickly because valuation already capitalizes sustained efficiency gains rather than recovery optionality.
This is above the General Electric stock’s 1-Year historical operating margin of 21%, indicating the model assumes incremental efficiency improvement rather than aggressive reinvestment.
3. Exit P/E Multiple: 39.4x
The exit multiple reflects General Electric stock’s positioning as a high-quality industrial with long-cycle cash flows and recurring aftermarket earnings.
Any disappointment in growth or margin durability would shift risk toward multiple compression, as the valuation leaves limited room for sentiment-driven re-rating.
This is below the 1-Year historical P/E multiple of 43x, indicating the model assumes valuation normalization despite stronger operating fundamentals.
What Happens If Things Go Better or Worse?
General Electric stock outcomes depend on commercial engine utilization, aftermarket service execution, and defense production discipline, setting up a range of possible paths through 2031.
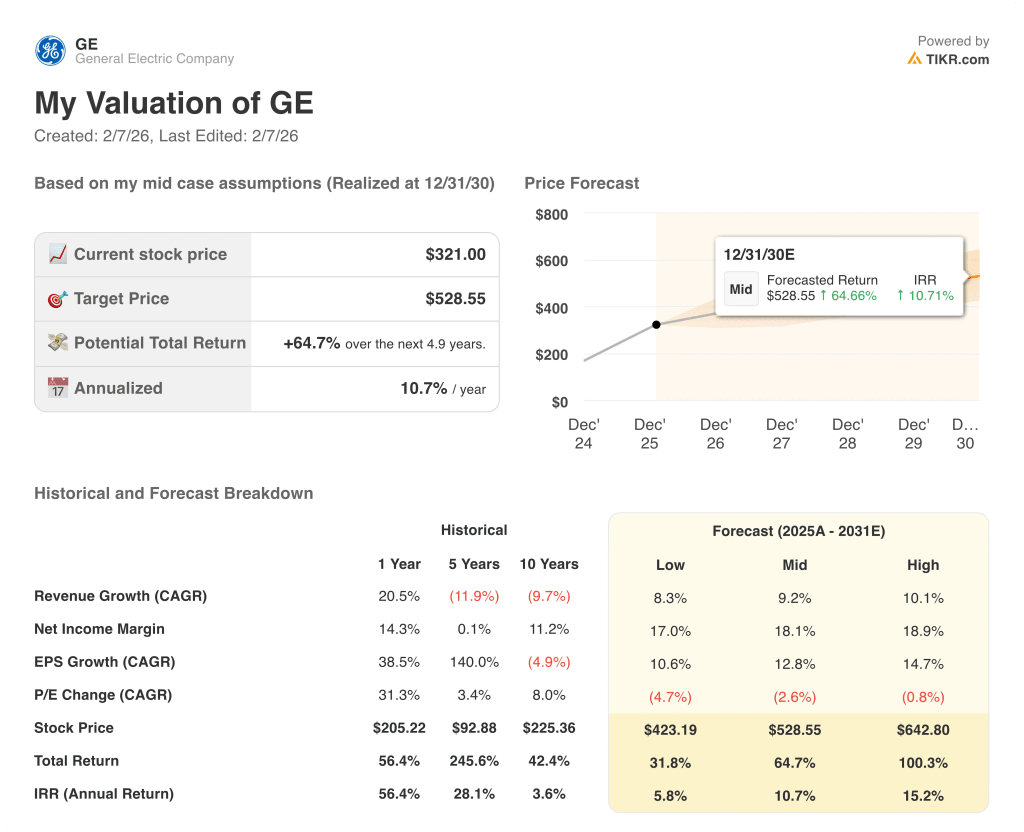
- Low Case: If aftermarket momentum slows and defense volumes normalize, revenue grows 8.3% and margins stay near 17.0% → 5.8% annualized return.
- Mid Case: With commercial services performing steadily and cost control holding, revenue growth near 9.2% and margins improving toward 18.1% → 10.7% annualized return.
- High Case: If shop visit throughput accelerates and defense execution remains tight, revenue reaches 10.1% and margins approach 18.9% → 15.2% annualized return.
How Much Upside Does General Electric Stock Have From Here?
With TIKR’s new Valuation Model tool, you can estimate a stock’s potential share price in under a minute.
All it takes is three simple inputs:
- Revenue Growth
- Operating Margins
- Exit P/E multiple
If you’re not sure what to enter, TIKR automatically fills in each input using analysts’ consensus estimates, giving you a quick, reliable starting point.
From there, TIKR calculates the potential share price and total returns under Bull, Base, and Bear scenarios so you can quickly see whether a stock looks undervalued or overvalued.
Looking for New Opportunities?
- See what stocks billionaire investors are buying so you can follow the smart money.
- Analyze stocks in as little as 5 minutes with TIKR’s all-in-one, easy-to-use platform.
- The more rocks you overturn… the more opportunities you’ll uncover. Search 100K+ global stocks, global top investor holdings, and more with TIKR.
Disclaimer:
Please note that the articles on TIKR are not intended to serve as investment or financial advice from TIKR or our content team, nor are they recommendations to buy or sell any stocks. We create our content based on TIKR Terminal’s investment data and analysts’ estimates. Our analysis might not include recent company news or important updates. TIKR has no position in any stocks mentioned. Thank you for reading, and happy investing!