
Key Takeaways:
- Capital Actions: Bank of America stock declared a $0.28 quarterly dividend and scheduled a March 10 redemption of Series DD preferred at $1,000, reinforcing capital return while reducing higher-cost instruments.
- Reporting Reset: Bank of America stock recast 2024–2025 results after a tax-equity accounting change, keeping net income largely intact while tightening comparability for efficiency and leverage targets like 200 basis points.
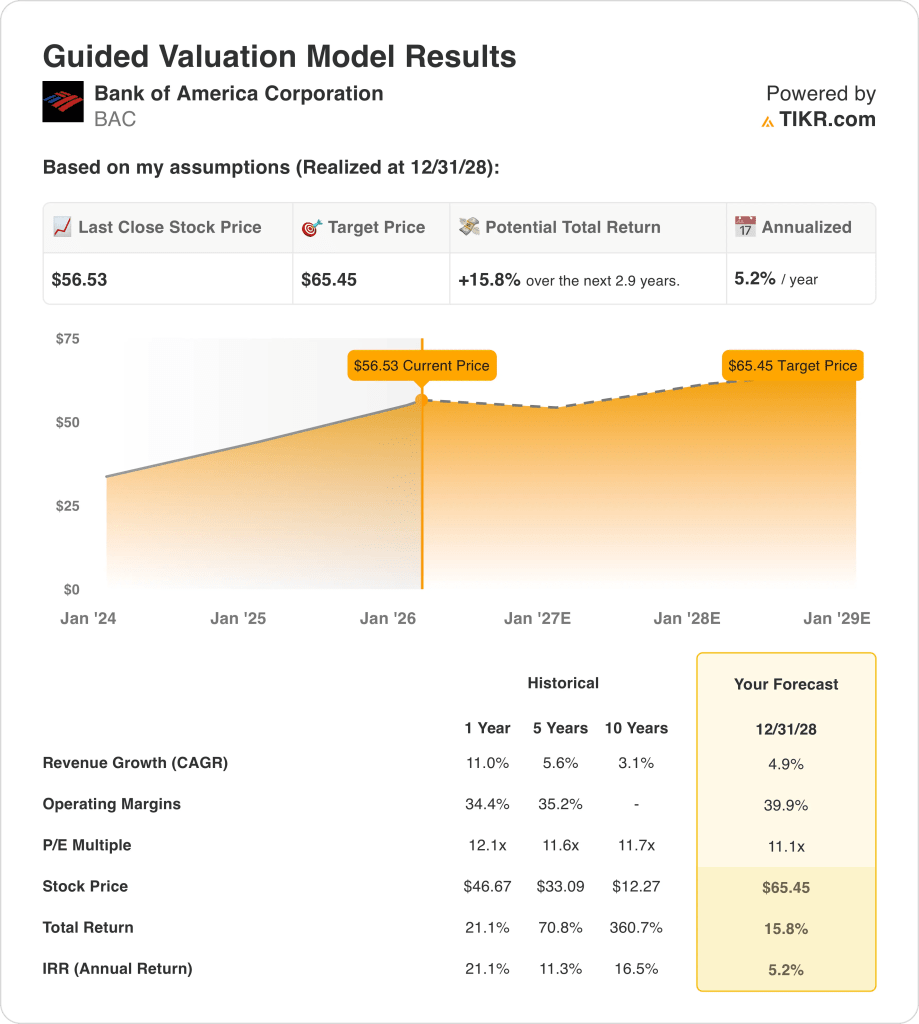
- Price Framework: With 5% revenue growth and 40% operating margins through 2028, an 11x exit multiple supports a $65 target price for Bank of America stock.
- Return Math: Bank of America stock implies 16% total upside from $57 to $65, translating into a 5% annualized return over 3 years.
Bank of America Corporation (BAC) is a diversified financial institution spanning Consumer Banking, Wealth, Global Banking, and Markets, generating $113 billion of 2025 revenue from net interest income, advisory fees, trading activity, and asset management services.
Earnings capacity reflects balance sheet scale, with $139 billion of interest income offset by $78 billion of interest expense, producing $60 billion of net interest income as asset repricing and deposit mix support spreads.
Cost discipline remains central, as $17 billion of quarterly expenses and $43 billion of 2025 EBIT translate into a 38% operating margin that anchors incremental profitability from loan growth and fee normalization.
Management has emphasized execution over expansion, with CFO Alastair Borthwick stating, “We expect to generate about 200 basis points of operating leverage in 2026,” directly linking expense control to return progression.
At $57 per share, Bank of America stock faces a valuation tension, as a $65 modeled price by 2028 implies 16% upside while annualized returns near 5% challenge whether efficiency gains sufficiently compensate equity risk.
What the Model Says for BAC Stock
Bank of America stock’s scale, regulatory capital demands, and mature U.S. banking exposure constrain growth expectations despite solid operating efficiency and diversification.
Based on the valuation framework, the model applies 4.9% revenue growth, 39.9% margins, and an 11.1x exit multiple to arrive at a $65.45 target price.
In return terms, the modeled 15.8% total upside and 5.2% annualized return provide limited compensation for equity risk and foregone alternatives.
On a risk-adjusted basis, the model signals a Sell for BAC stock, as a 5.2% annualized return falls short of disciplined equity return requirements.
Against a typical 10% equity hurdle, the 5.2% modeled return favors capital preservation over appreciation, confirming inadequate risk-adjusted compensation under valuation-driven logic.
Our Valuation Assumptions
TIKR’s Valuation Model lets you plug in your own assumptions for a company’s revenue growth, operating margins, and P/E multiple, and calculates the stock’s expected returns.
Here’s what we used for Bank of America stock:
1. Revenue Growth: 4.9%
BAC stock’s historical revenue performance reflects a mature, diversified banking franchise where balance sheet scale and fee mix limit outsized expansion across credit cycles.
Current support for 4.9% revenue growth comes from 10% net interest income growth, 7% total revenue growth in 2025, and sustained momentum in investment banking, trading, and wealth fees.
Forward performance requires continued loan growth near mid single digits, stable deposit pricing discipline, and capital markets activity holding near 2025 levels despite rate normalization risks.
According to consensus analyst estimates, any shortfall from 4.9% growth quickly limits earnings leverage, weakening total returns despite stable margins and compressing valuation support.
This is below the 1-year historical revenue growth of 11%, indicating the model assumes a mature growth profile with limited cyclical rebound.
2. Operating Margins: 39.9%
Historical profitability reflects structurally high margins supported by deposit scale, fee diversification, and expense discipline, with returns closely tied to operating leverage rather than volume growth alone.
Current execution supports 39.9% margins through 300 basis points of operating leverage, flat headcount near 213,000 employees, and revenue growth outpacing expense growth by several hundred basis points.
Sustaining margins requires fee growth to offset wage inflation, technology investment near $13 billion annually, and credit costs remaining near 44 basis points (Bank of America is losing $0.44 for every $100 of loans due to defaults) as economic conditions normalize.
Margin slippage emerges rapidly if revenue growth slows, since compensation and technology costs reset slower than income, compressing returns before capital flexibility can respond.
This is above the BAC stock’s 1-year historical operating margin of 34% which implies that the model assumes improved cost discipline without cyclical credit stress.
3. Exit P/E Multiple: 11.1x
Historically, large diversified banks trade at restrained earnings multiples reflecting capital intensity, regulatory constraints, and earnings sensitivity to macro conditions rather than structural scarcity.
The 11.1× exit multiple aligns with normalized profitability assuming mid cycle returns, stable credit quality, and no incremental multiple expansion beyond current market expectations.
Realization depends on maintaining returns on tangible equity progression toward mid teens while avoiding regulatory or credit shocks that historically compress bank valuation multiples.
This is in line with the 1-year historical P/E multiple of 12×, indicating the model assumes valuation normalization rather than re-rating potential.
What Happens If Things Go Better or Worse?
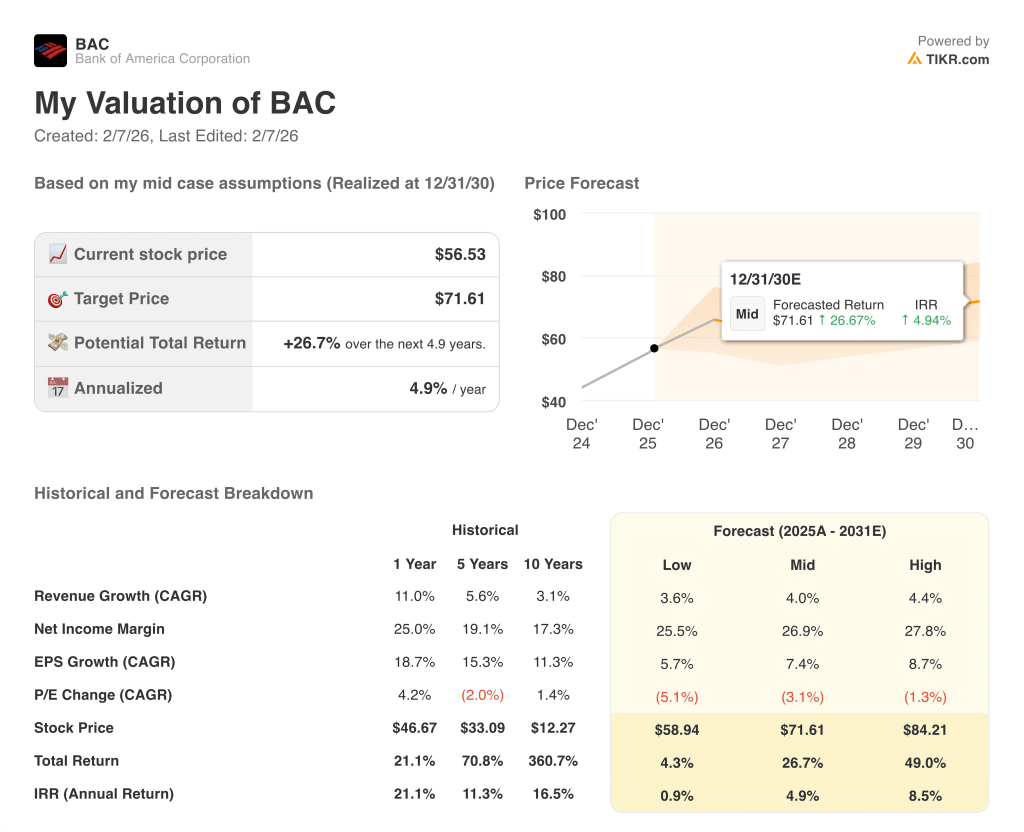
BAC stock performance depends on loan demand normalization, net interest income stability, expense control, and credit cost containment, creating differentiated paths through 2030.
- Low Case: If loan growth stalls and credit normalization pressures costs, revenue grows 3.6% with margins near 25.5% and valuation compresses → 0.9% annualized return.
- Mid Case: With core banking execution holding steady, revenue growth near 4.0% and margins improving toward 26.9% support stable valuation → 4.9% annualized return.
- High Case: If loan demand reaccelerates and cost discipline persists, revenue reaches 4.4% and margins approach 27.8% with easing valuation pressure → 8.5% annualized return.
How Much Upside Does Bank of America Stock Have From Here?
With TIKR’s new Valuation Model tool, you can estimate a stock’s potential share price in under a minute.
All it takes is three simple inputs:
- Revenue Growth
- Operating Margins
- Exit P/E multiple
If you’re not sure what to enter, TIKR automatically fills in each input using analysts’ consensus estimates, giving you a quick, reliable starting point.
From there, TIKR calculates the potential share price and total returns under Bull, Base, and Bear scenarios so you can quickly see whether a stock looks undervalued or overvalued.
Looking for New Opportunities?
- See what stocks billionaire investors are buying so you can follow the smart money.
- Analyze stocks in as little as 5 minutes with TIKR’s all-in-one, easy-to-use platform.
- The more rocks you overturn… the more opportunities you’ll uncover. Search 100K+ global stocks, global top investor holdings, and more with TIKR.
Disclaimer:
Please note that the articles on TIKR are not intended to serve as investment or financial advice from TIKR or our content team, nor are they recommendations to buy or sell any stocks. We create our content based on TIKR Terminal’s investment data and analysts’ estimates. Our analysis might not include recent company news or important updates. TIKR has no position in any stocks mentioned. Thank you for reading, and happy investing!