Key Takeaways:
- Premium Spend Engine: American Express stock delivered $72 billion of 2025 revenue on resilient premium spending, with management guiding 9% to 10% revenue growth for 2026.
- Capital Return Signal: American Express stock paired growth with shareholder returns, including a 16% dividend increase to $1 and $8 billion of 2025 capital returns via buybacks and dividends.
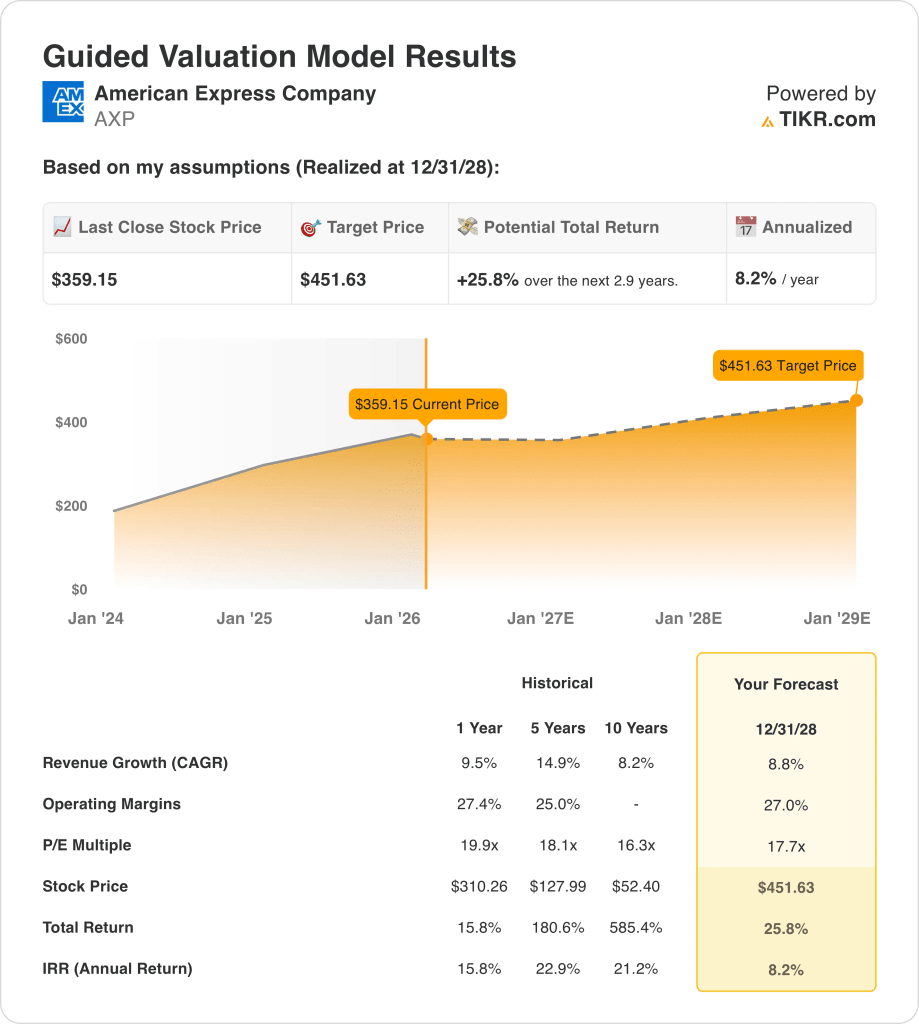
- Price Projection: Based on 9% revenue growth, 27% operating margins, and an 18x exit multiple, American Express stock could reach $452 by December 2028.
- Upside Math: This target implies 26% upside from the current $359 price for American Express stock, translating to an 8% annualized return.
American Express Company (AXP) earns revenue from card spending, fees, net interest income, and merchant services, serving consumers and businesses across more than 10 regions worldwide.
In 2025, company revenue reached $72 billion while operating expenses totaled $53 billion, supporting $14 billion of operating income and a 21% operating margin that reflects scale and a premium customer mix.
Management framed 2026 as a continuation of premium momentum, as Head of Investor Relations, Kartik Ramachandran stating, “we expect 2026 revenue growth of 9% to 10% and EPS of $17.30 to $17.90.”
American Express is leaning into product refreshes and technology, including $6 billion of 2025 marketing spend and a $5 billion annual technology budget aimed at improving personalization, fraud tools, and digital servicing efficiency.
With AXP stock at $359 and a model-based $452 target tied to an 18x multiple, investors are weighing durable premium economics against an 8% annualized payoff.
What the Model Says for AXP Stock
American Express’s premium-focused model, strong credit discipline, and high operating leverage support steady performance but limit outsized growth given capital intensity.
However, the model assumes 8.8% revenue growth, 27.0% operating margins, and a 17.7x exit multiple, producing a $451.63 target price.
As framed by the valuation, the 25.8% total upside and 8.2% annualized return imply moderate appreciation that compares unfavorably with higher-return equity opportunities.
On that basis, the model signals a Sell, since the projected 8.2% annualized return does not sufficiently compensate for equity risk under disciplined capital allocation standards.
Measured against a typical 10% equity hurdle, an 8.2% annualized return favors capital preservation over appreciation, indicating that expected returns provide insufficient risk-adjusted compensation and reinforcing a Sell conclusion.
Our Valuation Assumptions
TIKR’s Valuation Model lets you plug in your own assumptions for a company’s revenue growth, operating margins, and P/E multiple, and calculates the stock’s expected returns.
Here’s what we used for AXP stock:
1. Revenue Growth: 8.8%
AXP stock has delivered mid-to-high single digit revenue growth through premium card expansion, fee-based income, and global spending resilience, with recent performance normalizing after post-pandemic acceleration.
Current execution is supported by 10% full-year revenue growth in 2025, double-digit card fee growth, and sustained spending strength from premium consumer, travel, and commercial card members.
Sustaining 8.8% growth requires continued premium card acquisition, stable consumer spending, and limited macro disruption, while a slowdown in travel, small business demand, or credit tightening would pressure billed business quickly.
According to consensus analyst estimates, modest shortfalls in spend or card growth would compress revenue rapidly, weakening operating leverage and reducing valuation support before cost flexibility offsets decline.
This is below the 1-Year historical revenue growth of 9.5%, indicating the model assumes normalization toward maturity rather than a return to peak expansion conditions.
2. Operating Margins: 27%
American Express stock has structurally high margins due to its closed-loop network, premium customer mix, and pricing power, with margins historically holding in the mid-to-high 20% range.
Current performance reflects operating margins of 27.4%, supported by scale benefits, disciplined expense control, and credit quality remaining below pre-2019 loss levels.
Maintaining 27.0% margins depends on sustained marketing efficiency, stable rewards costs, and contained credit normalization, while competitive spend escalation or higher provisions would erode profitability quickly.
Based on street consensus estimates, even small increases in rewards, marketing, or credit losses would pressure margins immediately, reducing earnings durability and tightening valuation outcomes before revenue growth absorbs stress.
This is in line with the 1-Year historical operating margin of 27.4%, indicating the model assumes stability rather than further margin expansion despite ongoing investment intensity.
3. Exit P/E Multiple: 17.7x
The exit multiple capitalizes American Express stock’s terminal earnings based on business maturity, brand durability, and normalized growth rather than peak-cycle performance or sentiment-driven re-rating.
At exit, the model already embeds 8.8% revenue growth and 27.0% margins, leaving the 17.7x multiple to reflect sustainable earnings quality rather than incremental optimism.
This multiple holds if premium spending, credit discipline, and fee income remain durable, while weaker growth or higher losses would shift investor focus toward downside protection rather than valuation support.
As reflected in consensus expectations, earnings disappointment would likely trigger multiple compression rather than expansion, limiting upside asymmetry and amplifying downside risk at the end of the forecast period.
This is below the 1-Year historical P/E of 19.9x, indicating the model assumes valuation compression consistent with normalized growth and reduced re-rating potential.
What Happens If Things Go Better or Worse?
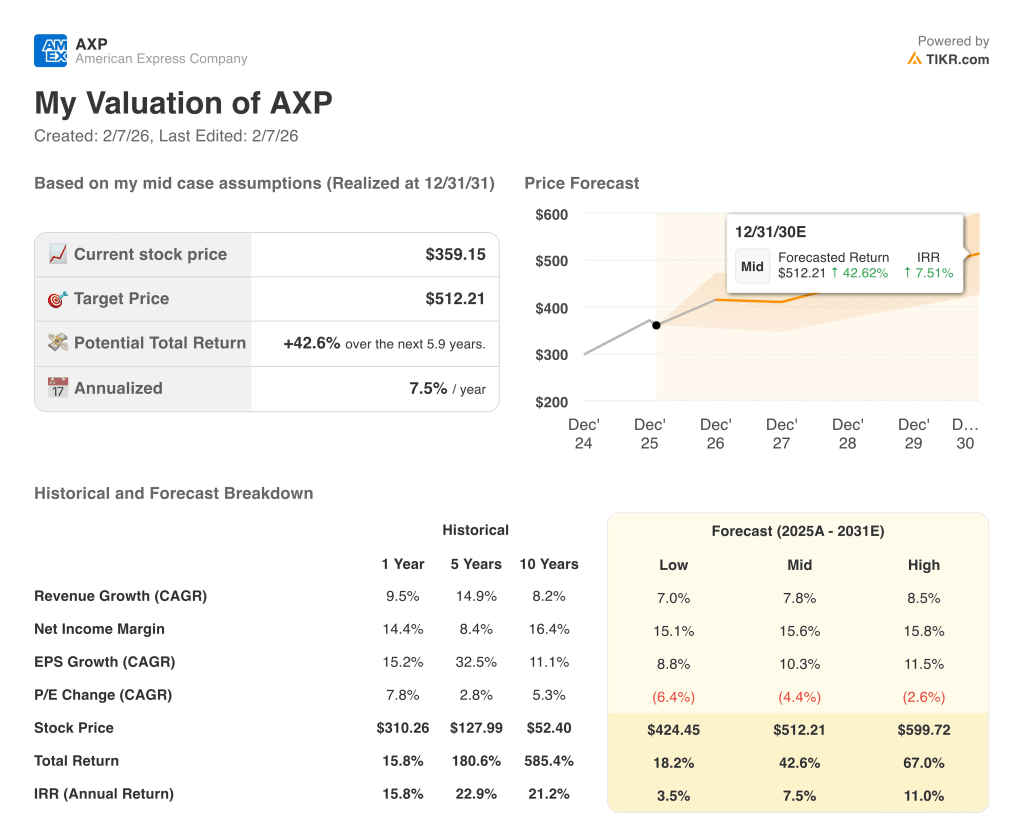
American Express stock outcomes depend on premium card spending, credit discipline, and marketing efficiency, setting up a range of possible paths through 2031.
- Low Case: If consumer spending softens and rewards costs rise, revenue grows around 7.0% and margins stay near 15.1% → 3.5% annualized return.
- Mid Case: With premium demand holding and cost control intact, revenue growth near 7.8% and margins improving toward 15.6% → 7.5% annualized return.
- High Case: If premium engagement accelerates and credit remains benign, revenue reaches about 8.5% and margins approach 15.8% → 11.0% annualized return.
How Much Upside Does American Express Stock Have From Here?
With TIKR’s new Valuation Model tool, you can estimate a stock’s potential share price in under a minute.
All it takes is three simple inputs:
- Revenue Growth
- Operating Margins
- Exit P/E multiple
If you’re not sure what to enter, TIKR automatically fills in each input using analysts’ consensus estimates, giving you a quick, reliable starting point.
From there, TIKR calculates the potential share price and total returns under Bull, Base, and Bear scenarios so you can quickly see whether a stock looks undervalued or overvalued.
Looking for New Opportunities?
- See what stocks billionaire investors are buying so you can follow the smart money.
- Analyze stocks in as little as 5 minutes with TIKR’s all-in-one, easy-to-use platform.
- The more rocks you overturn… the more opportunities you’ll uncover. Search 100K+ global stocks, global top investor holdings, and more with TIKR.
Disclaimer:
Please note that the articles on TIKR are not intended to serve as investment or financial advice from TIKR or our content team, nor are they recommendations to buy or sell any stocks. We create our content based on TIKR Terminal’s investment data and analysts’ estimates. Our analysis might not include recent company news or important updates. TIKR has no position in any stocks mentioned. Thank you for reading, and happy investing!