Key Takeaways:
- Cost Discipline: Shell stock frames 2025 as an execution year, with $5 billion of structural cost reductions already achieved toward a $5 billion to $7 billion 2028 goal.
- Capital Returns: Shell stock pairs that discipline with shareholder payouts, announcing a $4% dividend increase and a $4 billion buyback program to reinforce per-share value delivery.
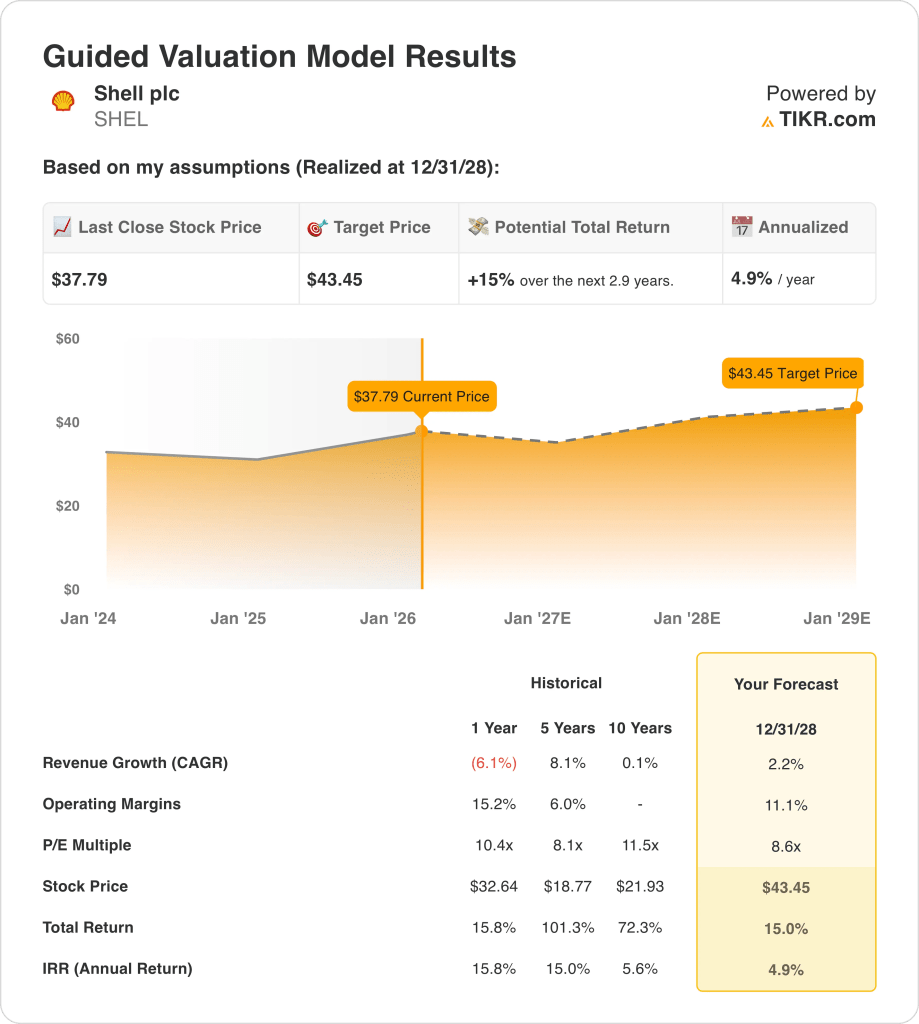
- Price Target: Based on 2% revenue growth, 11% operating margins, and a 9x exit multiple, Shell stock could reach $43 by December 2028.
- Modeled Upside: Shell stock implies 15% upside from the current $38 price, translating into a 5% annualized return over 3 years.
Shell (SHEL) is a global integrated energy and chemicals group, selling fuels, LNG, and refined products while monetizing trading and premium downstream margins across 5 major segments.
In 2025, the company produced $19 billion of adjusted earnings, generated $43 billion of cash flow from operations, and delivered $26 billion of free cash flow with gearing at 21%.
Capital allocation remains bounded by a $20 billion to $22 billion cash CapEx range in 2026 alongside a 40% to 50% CFFO distribution framework and a $4 billion buyback program.
CEO Wael Sawan, in earnings call last week set the tone: “deliver structural cost reductions of $5 billion to $7 billion by the end of 2028,” after $5 billion of reductions were reached by 2025.
Shell stock trades on a valuation debate where a $38 share price discounts a 9x exit multiple and a $43 2028 target, even as the model’s 5% annual return tests cash-flow durability versus opportunity cost.
What the Model Says for SHEL Stock
Shell stock’s capital-intensive portfolio, mature energy markets, and cyclical exposure constrain growth expectations despite strong scale and cash generation.
However, the model assumes 2.2% revenue growth, 11.1% operating margins, and an 8.6x exit multiple, producing a $43 target price.
Therefore, the modeled 15% total upside and 4.9% annualized return fail to compensate for equity risk versus alternative allocations.
All in all, the model signals a Sell, as a 4.9% annualized return reflects insufficient risk-adjusted compensation at current valuation levels.
At a modeled 4.9% annualized return that falls below a typical 10% equity hurdle, the valuation favors capital preservation over appreciation, indicating returns do not adequately compensate for cyclical risk, supporting a Sell under disciplined capital allocation logic.
Our Valuation Assumptions
TIKR’s Valuation Model lets you plug in your own assumptions for a company’s revenue growth, operating margins, and P/E multiple, and calculates the stock’s expected returns.
Here’s what we used for Shell stock:
1. Revenue Growth: 2.2%
The revenue profile of Shell stock reflects exposure to commodity cycles, portfolio pruning, and disciplined capital allocation, with recent performance shaped more by price normalization than structural volume expansion.
Current execution supports modest growth through LNG optimization, upstream reliability, and selective downstream investments, while management continues prioritizing cash flow resilience over aggressive volume-led expansion.
Forward performance requires stable energy demand and disciplined project execution, while weaker pricing, regulatory friction, or accelerated asset divestments would quickly cap topline momentum.
According to consensus analyst estimates, 2.2% growth sits below the 1-Year historical revenue change of negative 6%, signaling normalization assumptions where any demand shortfall immediately compresses valuation outcomes.
2. Operating Margins: 11.1%
Shell stock’s margin profile reflects an integrated energy model balancing upstream cash generation with structurally lower-margin downstream and trading activities, creating inherent limits on sustained margin expansion.
Recent execution shows margins supported by cost discipline, portfolio high-grading, and capital restraint, even as earnings normalize from prior-cycle peaks driven by elevated commodity prices.
Sustaining margins depends on stable pricing, operational reliability, and disciplined reinvestment, while margin pressure would emerge quickly from weaker energy spreads or cost inflation.
Based on street consensus estimates, 11.1% margins sit below the 1-Year historical operating margin of 15%, indicating that valuation support erodes rapidly if efficiency gains fail to offset cyclical normalization.
3. Exit P/E Multiple: 8.6x
Shell stock’s mature asset base, capital intensity, and commodity-linked earnings profile anchor valuation to normalized cash generation rather than growth-driven multiple expansion.
The exit multiple reflects earnings durability supported by scale, integration, and capital discipline, while recognizing limited re-rating potential in a structurally cyclical energy market.
Execution risk centers on sustaining free cash flow through the cycle, as earnings volatility or capital missteps would pressure investor confidence at the terminal valuation point.
Based on consensus analyst projections, an 8.6x exit multiple sits below the 1-Year historical P/E of 10x, indicating a conservative capitalization of terminal earnings that offers limited protection if cash flows undershoot expectations.
What Happens If Things Go Better or Worse?
Outcomes for Shell stock depend on commodity price normalization, portfolio discipline, and capital allocation execution, setting up a range of possible paths through 2030.
- Low Case: If commodity prices soften and downstream margins stay pressured, revenue grows 1.0% and margins hold near 6.7% → 0.1% annualized return.
- Mid Case: With stable pricing and steady upstream cash flow, revenue growth near 1.1% and margins improve toward 7.3% → 4.5% annualized return.
- High Case: If upstream strength persists and cost control tightens, revenue reaches 1.2% and margins approach 7.6% → 8.1% annualized return.

How Much Upside Does Shell Stock Have From Here?
With TIKR’s new Valuation Model tool, you can estimate a stock’s potential share price in under a minute.
All it takes is three simple inputs:
- Revenue Growth
- Operating Margins
- Exit P/E multiple
If you’re not sure what to enter, TIKR automatically fills in each input using analysts’ consensus estimates, giving you a quick, reliable starting point.
From there, TIKR calculates the potential share price and total returns under Bull, Base, and Bear scenarios so you can quickly see whether a stock looks undervalued or overvalued.
Looking for New Opportunities?
- See what stocks billionaire investors are buying so you can follow the smart money.
- Analyze stocks in as little as 5 minutes with TIKR’s all-in-one, easy-to-use platform.
- The more rocks you overturn… the more opportunities you’ll uncover. Search 100K+ global stocks, global top investor holdings, and more with TIKR.
Disclaimer:
Please note that the articles on TIKR are not intended to serve as investment or financial advice from TIKR or our content team, nor are they recommendations to buy or sell any stocks. We create our content based on TIKR Terminal’s investment data and analysts’ estimates. Our analysis might not include recent company news or important updates. TIKR has no position in any stocks mentioned. Thank you for reading, and happy investing!