Key Stats for Intel Stock
- Past-Week Performance: 9%
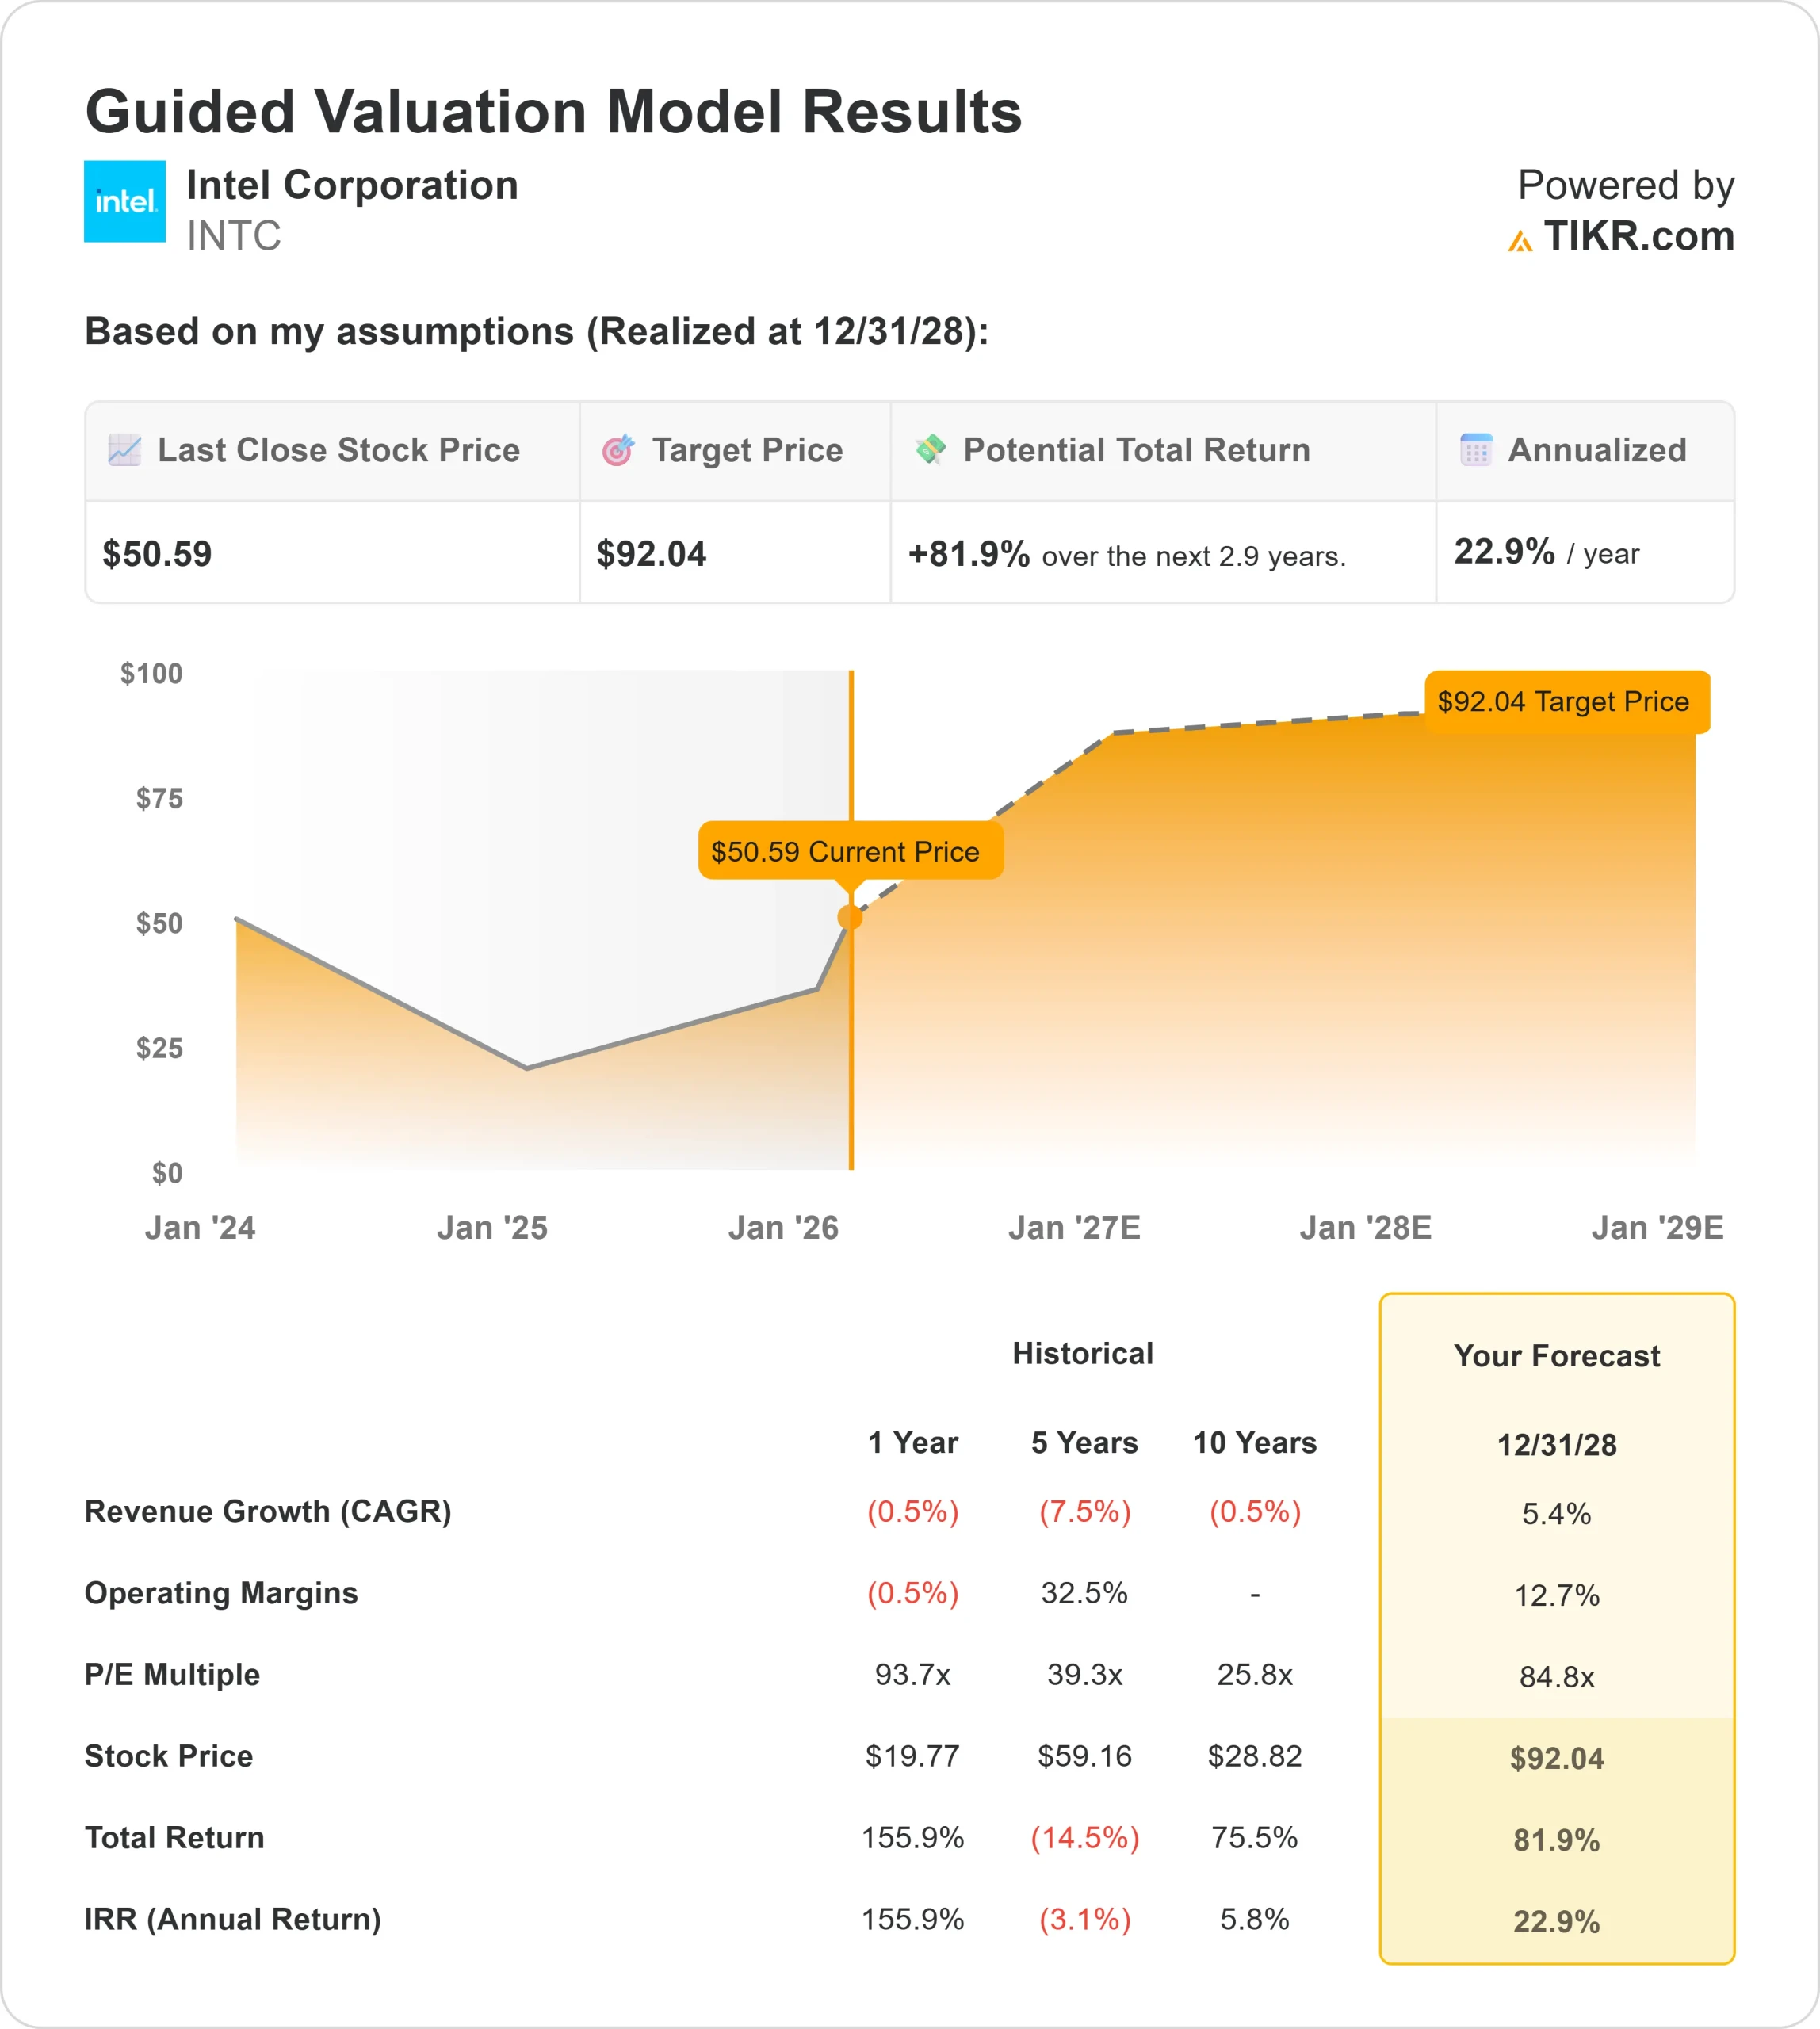
- 52-Week Range: $18 to $55
- Valuation Model Target Price: $92
- Implied Upside: 82%
Value your favorite stocks like Intel with 5 years of analysts’ forecasts using TIKR’s new Valuation Model (It’s free) >>>
What Happened?
Intel Corporation stock rose about 9% this week, finishing near $51 per share, as investors leaned back into the name following improving sentiment around Intel’s turnaround execution. The advance reflected renewed confidence in manufacturing progress alongside growing institutional engagement after a prolonged period of skepticism.
Shares moved higher this week after Intel disclosed concrete progress on its foundry turnaround, reinforcing confidence that execution risks are beginning to ease.
At Intel’s AI Summit, CEO Lip-Bu Tan highlighted accelerating momentum in the foundry business, citing 7% to 8% monthly yield improvements on the 18A process, confirmation that a 0.5 PDK will be available this month, and customer discussions advancing toward volume commitments expected in the second half of 2026.
Tan summed up the shift by saying “a couple of customers are knocking on my door now,” signaling rising confidence in Intel’s manufacturing credibility.
Institutional activity added further support. Hantz Financial Services more than doubled its Intel stake in the third quarter, lifting holdings to 48,300 shares worth about $1.62 million, while ABN AMRO Bank N.V. initiated a new position of 142,533 shares valued at roughly $4.78 million.
AGF Management also opened a new stake of 50,909 shares worth about $1.71 million, reinforcing signs of renewed institutional interest.
Offsetting some of that buying, several firms trimmed exposure. Willis Investment Counsel reduced its position by 3.2% to 292,697 shares, and BI Asset Management Fondsmaeglerselskab A/S cut its stake by 17.7% to 236,489 shares.
Even with selective trimming, the mix of new positions, stake increases, and clearer operational progress helped explain why Intel shares held their gains through the week rather than fading after the initial move.
See analysts’ growth forecasts and price targets for Intel (It’s free) >>>
Is Intel Undervalued?
Under valuation assumptions, the stock is modeled using:
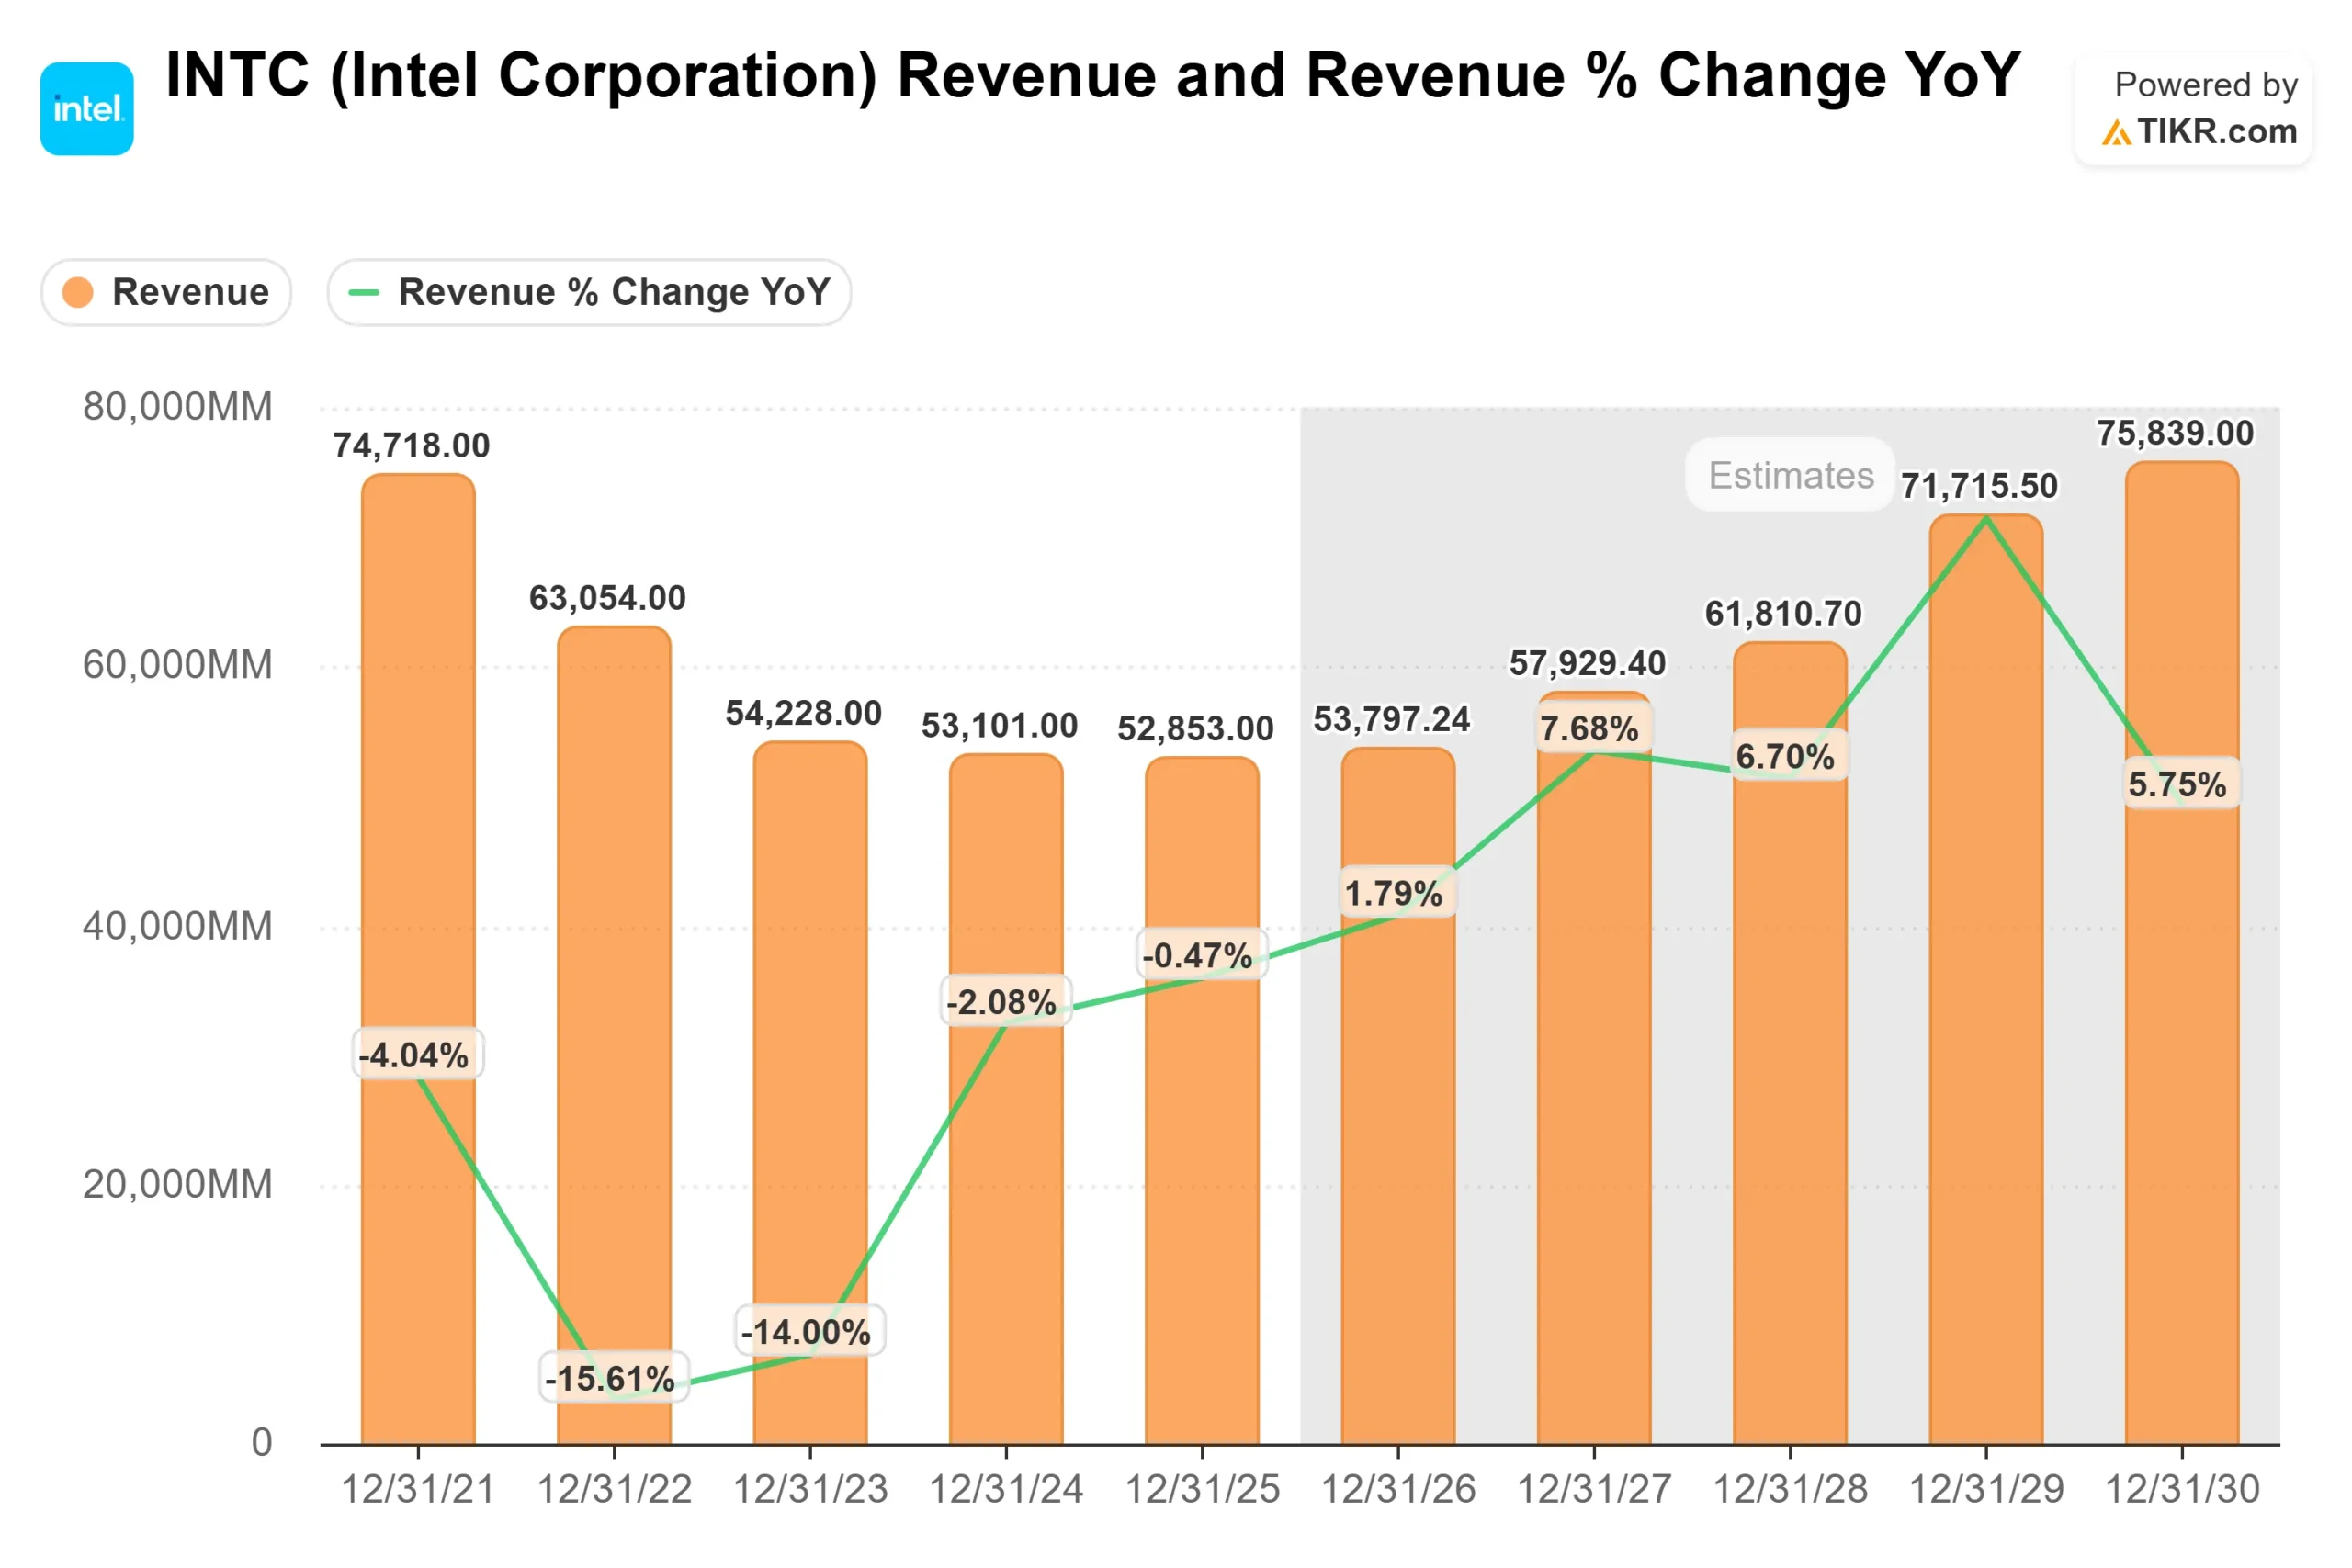
- Revenue Growth (CAGR): 5.4%
- Operating Margins: 12.7%
- Exit P/E Multiple: 84.8x
Intel’s revenue outlook reflects a recovery phase rather than aggressive expansion, with growth increasingly tied to stabilization in core CPU demand and incremental contributions from its foundry business as external customer engagement broadens.
What matters more for returns is margin trajectory. Improving fab utilization, yield gains on advanced nodes, and tighter cost discipline create a setup where even mid-single-digit revenue growth can drive outsized earnings leverage as fixed costs are absorbed more efficiently.
Based on these inputs, the model estimates a target price of about $92, implying roughly 82% total upside over approximately 2.9 years, indicating the stock appears undervalued at current prices.
Results over the next year hinge on several higher-impact developments. Continued yield improvement on 18A, early volume commitments from foundry customers, and reduced cash burn as depreciation peaks would all signal that Intel’s heavy investment cycle is beginning to pay off.
At the same time, stabilization in PC demand, growing AI-related compute needs, and progress toward a broader CPU and GPU roadmap could support incremental revenue growth without requiring a full industry upcycle.
At current levels, Intel appears undervalued, with future performance driven less by aggressive revenue acceleration and more by margin normalization, improving manufacturing execution, and a clearer path back to sustainable earnings growth.
Estimate a company’s fair value instantly (Free with TIKR) >>>
Value Any Stock in Under 60 Seconds (It’s Free)
With TIKR’s new Valuation Model tool, you can estimate a stock’s potential share price in under a minute.
All it takes is three simple inputs:
- Revenue Growth
- Operating Margins
- Exit P/E Multiple
From there, TIKR calculates the potential share price and total returns under Bull, Base, and Bear scenarios so you can quickly see whether a stock looks undervalued or overvalued.
If you’re not sure what to enter, TIKR automatically fills in each input using analysts’ consensus estimates, giving you a quick, reliable starting point.
See a stock’s true value in under 60 seconds (Free with TIKR) >>>