Key Stats for Compass Stock
- 52-Week Range: $5.7 to $14
- Current Price: $7.2
- Street Mean Target: $13.6
- Street High Target: $17
- TIKR Model Target (Dec. 2030): $12.8
What Happened?
Compass, Inc. (COMP), the largest residential real estate brokerage in the United States, closed its acquisition of Anywhere Real Estate on January 9, 2026, creating a combined network of 340,000 real estate professionals across 120 countries, even as Compass stock trades 48% below its 52-week high of $13.96.
Q4 results released February 26 delivered quarterly revenue of $1.70 billion rising 23.1% year over year and adjusted EBITDA of $58.3 million surging 249% from the year-ago period, beating the high end of guidance on both lines before the Anywhere acquisition had contributed a single dollar.
The undeniable operational number is agent momentum: Compass added 830 principal agents in Q4 alone, a fourth quarter record, while quarterly principal agent retention held at 96.8%, and organic transactions grew 5.6% against a market that grew just 0.7%.
Robert Reffkin, Founder and Chief Executive Officer, stated on the Q4 2025 earnings call that “I am making a CEO commitment to action $250 million of cost synergies in the first year” and raised the three-year target to $400 million, up from the original $300 million announced in November, with $175 million already actioned just 6.5 weeks after close.
Compass enters 2026 as a fundamentally different business: the Rocket Companies three-year exclusive alliance routes 1.2 million high-intent leads annually to Compass agents, the Zillow antitrust lawsuit was dismissed March 18 after Zillow reversed its listing ban, and the $400 million synergy commitment over three years gives the combined platform a path to EBITDA margins the pre-merger Compass could never reach alone.
Wall Street’s Take on COMP Stock
The Anywhere acquisition nearly doubles reported revenue in 2026 to a consensus $13.68 billion, but the real re-rating story is EBITDA: consensus expects Compass to more than double EBITDA from $290 million in 2025 to $780 million in 2026 as $100 million in actioned synergies begin flowing through the P&L.
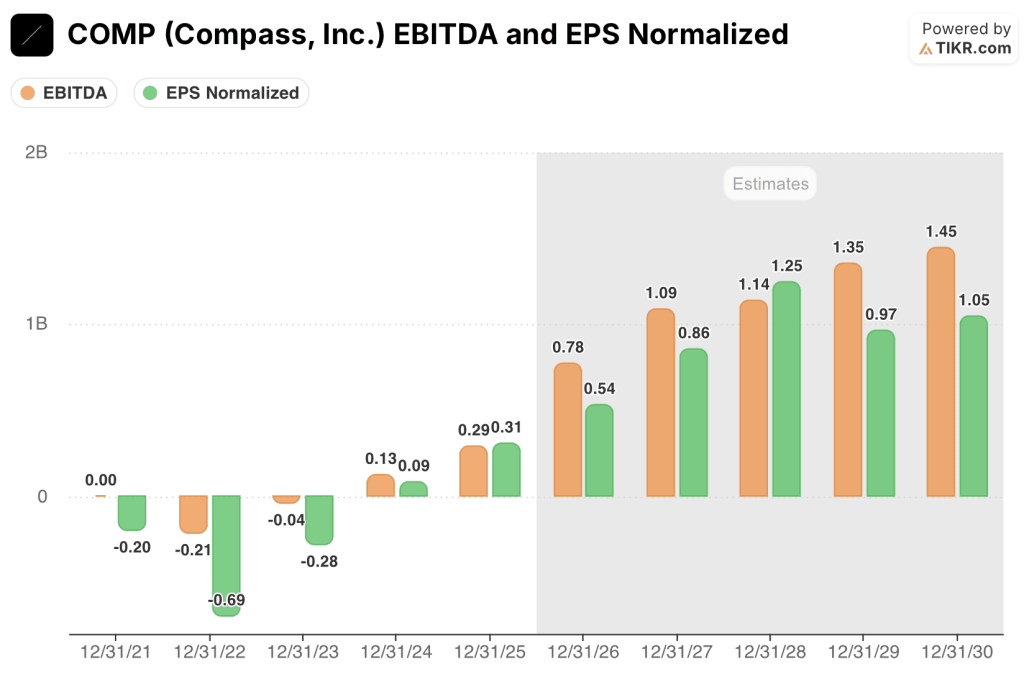
Compass stock’s normalized EPS is forecast to reach $0.54 in 2026 and $0.86 in 2027, with the 2026 figure representing a 72.5% jump backed by cost takeouts already actioned rather than revenue assumptions that have yet to materialize.

Nine of 12 analysts hold a buy or outperform rating on Compass stock, with a mean 12-month price target of $13.58 implying 87.9% upside from the current price; what the Street is waiting to see is whether the $175 million in synergies already actioned translates into the $44 million of quarterly realization CFO Scott Wahlers guided for Q4 2026.
The high target of $17 versus the low of $9 maps directly to the synergy execution debate: bulls price in $400 million realized over three years and a housing market recovery; bears anchor to the $3.15 billion in assumed debt and the Q1 2026 free cash flow hole Wahlers disclosed will be materially negative.
Trading at roughly 13.4x 2026 normalized EPS against a consensus EPS CAGR of approximately 61% through 2027, and sitting near the bottom of its 52-week range despite a transformational acquisition and $175 million in cost synergies already actioned, Compass stock appears undervalued as the market prices the integration risk without crediting the pace at which the synergy program is actually running.
Housing market deterioration or a further rise in mortgage rates would compress transaction volumes and make the synergy math insufficient to offset revenue weakness, breaking the EBITDA ramp entirely.
Watch Q2 2026 results for the first clean quarter of synergy realization: the $44 million guided for Q4 2026 requires a visible step-up trajectory beginning in Q2 to be credible.
Compass Stock Financials
Compass’s operating loss narrowed to ($0.03 billion) in 2025, representing an operating margin of (0.4%), a dramatic improvement from (1.4%) in 2024 and (5.7%) in 2023 as the pre-merger Compass business systematically reduced cost intensity across three consecutive years.
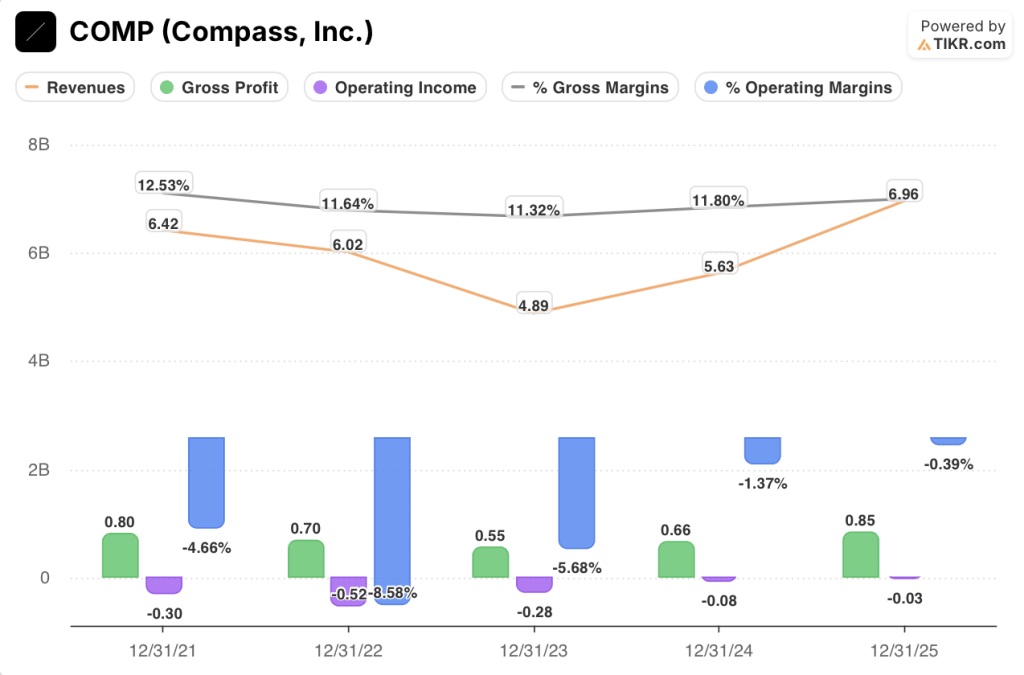
Gross profit reached $0.85 billion at a 12.2% gross margin in 2025, up from $0.66 billion at 11.8% in 2024, driven by the Christie’s International Real Estate acquisition in January 2025, which carries more favorable commission margins than Compass’s core brokerage, and a record level of title and escrow revenue in Q4.
The direction of travel is unambiguous: Compass has cut its operating loss from ($0.30 billion) in 2021 to ($0.03 billion) in 2025, a 90% reduction over four years, entirely before the Anywhere synergy program adds a single dollar of benefit.
What Does the Valuation Model Say?
The TIKR model assigns a mid-case target of $12.76, implying 76.5% total return over 4.7 years at a 12.8% annualized IRR, anchored to 17.9% revenue CAGR and 5.4% net income margins as $400 million in committed synergies and the Rocket/Redfin lead pipeline convert a structurally unprofitable brokerage into a cash-generating platform.

Compass at 13.4x forward earnings with EPS growing 61% annually and $175 million in synergies already actioned makes COMP undervalued against a business whose cost structure is collapsing faster than the integration schedule originally assumed.
The three model cases for Compass hinge on a single variable: how much of the $400 million synergy commitment lands in the income statement before the housing market recovery arrives.
Low Case: If synergy realization trails guidance and housing volumes remain suppressed by elevated mortgage rates, revenue grows around 16.3% and net income margins stabilize near 5.0%, producing a target of $9 and 5.1% annualized return.
Mid Case: With $100 million in synergies realized in 2026 as guided, the Rocket/Redfin alliance driving incremental lead flow, and the Anywhere EBITDA contribution turning positive by mid-year, revenue grows near 17.9% and margins improve toward 5.4%, producing a target of $13 and 12.8% annualized return.
High Case: If the housing market recovers as mortgage rates ease, the synergy program outpaces the $400 million commitment, and agent count growth accelerates across the combined 340,000-agent platform, revenue reaches around 19.4% growth and margins approach 5.8%, producing a target of $17 and 20.3% annualized return.
The mid case requires no multiple expansion and no housing recovery — just $44 million of quarterly synergy realization by Q4 2026, a number Wahlers put on record on the earnings call, with the target rounding to $13.
Six weeks after closing Anywhere, Compass had already actioned $175 million in synergies, Anywhere’s top-quartile agent GCI retention hit its highest recorded level in January, and the Rocket/Redfin partnership is structurally exclusive with no equivalent available to competing brokerages.
Should You Invest in Compass, Inc.?
The only way to really know is to look at the numbers yourself. TIKR gives you free access to the same institutional-quality financial data that professional analysts use to answer exactly that question.
Pull up COMP stock and you’ll see years of historical financials, what Wall Street analysts expect for revenue and earnings in the quarters ahead, how valuation multiples have moved over time, and whether price targets are trending up or down.
You can build a free watchlist to track Compass, Inc. alongside every other stock on your radar. No credit card required. Just the data you need to decide for yourself.
Access Professional Tools to Analyze COMP stock on TIKR for Free →