Key Takeaways:
- Scale Roadmap Reset: Carvana laid out a 3 million unit ambition over 5 to 10 years while running near 600,000 units, framing growth as an execution problem across inspection, logistics, and inventory density.
- Headline Risk Catalyst: Carvana stock fell 12% to $413 after a short report in January 2026, while BofA cut its price objective to $460.
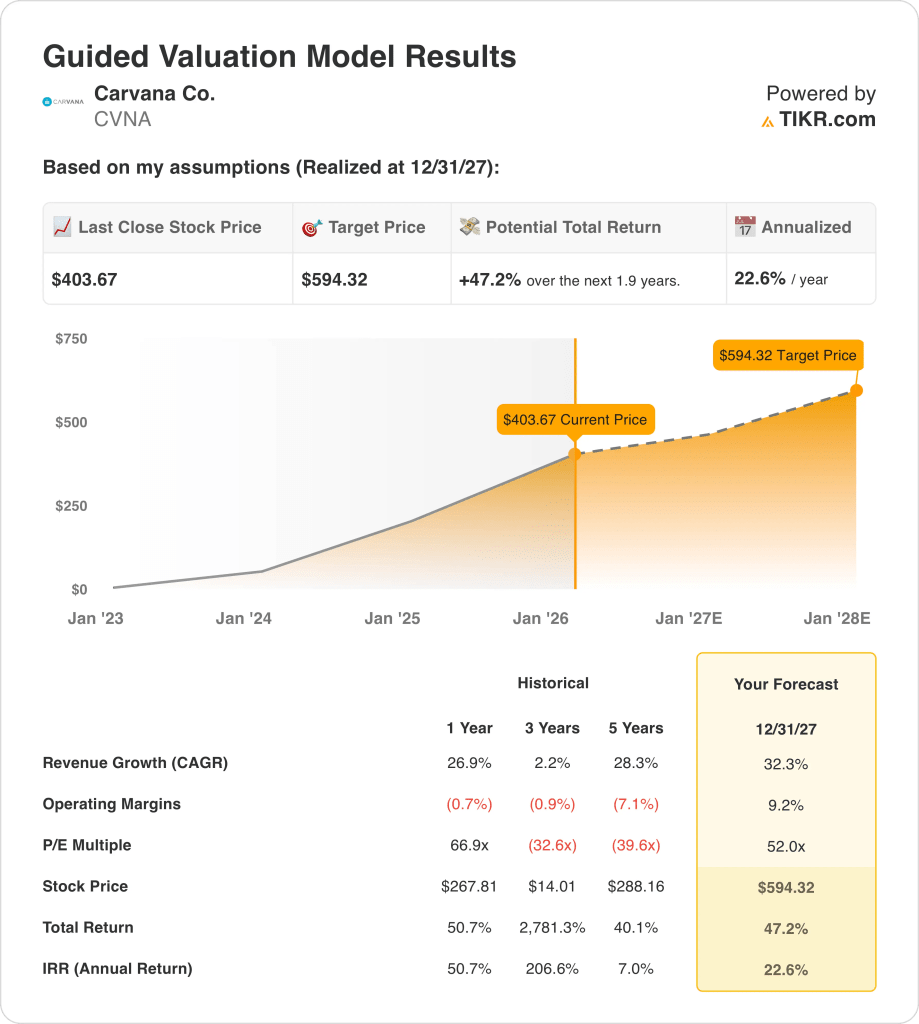
- Valuation Target Path: Based on 32% revenue growth, 9% operating margins, and a 52x exit P/E, Carvana stock could reach $594 by December 2027.
- Return Math Setup: From a current price of $404 to $594, Carvana stock implies 47% total upside over about 2 years, translating into roughly 23% annualized returns if the 2027 assumptions hold.
Carvana Co. (CVNA) acquires and reconditions used vehicles, sells inventory through an online platform, arranges financing and add-on products, and manages delivery across a U.S. used-car market of about 40 million annual transactions.
Over the last 12 months, revenue reached about $18 billion and gross profit about $4 billion, leaving roughly $2 billion of operating expenses and about $2 billion of operating income at a 9% operating margin.
At the November 2025 Wells Fargo summit, CEO Ernie Garcia said, “we’ve been run rating around 600,000 units per year,” framing a path toward 3 million units over 5 to 10 years.
Execution priorities now center on scaling reconditioning capacity and faster fulfillment, including same-day delivery rollouts like the February 2026 Eugene launch and continued ADESA site integrations, with management previously sizing full build-out CapEx near $1 billion.
At $404, valuation depends on whether 32% growth and 9% margins justify a 52x exit multiple.
What the Model Says for CVNA Stock
Carvana’s capital intensive logistics and reconditioning model elevates expectations as operating performance scales alongside competitive positioning.
Anchored on assumptions of 32.3% revenue growth, 9.2% operating margins, and a 52.0x exit multiple, the model delivers a $594.32 target price.
As a result, the valuation implies 47.2% total upside and a 22.6% annualized return when weighed against equity risk.
On this basis, the valuation model issues a Buy signal, since a 22.6% annualized return surpasses standard equity compensation thresholds.
Given a 22.6% annualized return relative to a typical 10% equity hurdle, the model favors capital appreciation over preservation, supporting a Buy under disciplined valuation principles.
Our Valuation Assumptions
TIKR’s Valuation Model lets you plug in your own assumptions for a company’s revenue growth, operating margins, and P/E multiple, and calculates the stock’s expected returns.
Here’s what we used for Carvana stock:
1. Revenue Growth: 32.3%
Carvana stock’s revenue history reflects pronounced cyclicality, marked by pullbacks during funding constraints and sharp recoveries as unit volumes and inventory availability rebound.
Present execution underpins a 32.3% growth assumption, supported by unit run rates nearing 600,000, broader same-day delivery coverage, and expanding reconditioning capacity.
Maintaining this pace depends on continuous operational scaling, a steady consumer credit backdrop, and incremental share capture within a roughly 40 million transaction market.
This growth path compounds tightly, where modest slippage in volumes or logistics efficiency would pressure revenue and erode valuation support rapidly.
This sits above the 1-year historical revenue growth of 26.9%, signaling that the model embeds a return to accelerated expansion rather than a normalized growth profile.
2. Operating Margins: 9.2%
Historically, Carvana stock posted negative operating margins as fixed costs, logistics intensity, and rapid expansion outweighed gross profit generation.
Recent performance shows operating margins turning positive near 9%, supported by higher gross profit per unit, overhead discipline, and scale benefits from ADESA integration.
Maintaining 9.2% margins depends on cost containment while expanding capacity, without margin dilution from pricing pressure or accelerated reinvestment.
Based on street consensus estimates, margin slippage would impair earnings leverage first, causing valuation sensitivity to spike as profit expectations reset faster than revenue.
This is above the 1-year historical operating margin of -1%, indicating the model assumes sustained cost discipline rather than reinvestment-driven compression.
3. Exit P/E Multiple: 52x
Carvana stock’s trading history shows elevated valuation multiples during expansion cycles, reflecting reliance on revenue momentum rather than consistent earnings durability.
The exit framework applies a 52× P/E to normalized net income, incorporating expected scale efficiencies, margin improvement, and a steadier operating profile.
Sustaining this multiple depends on earnings resilience as growth moderates and competitive dynamics limit profit erosion.
As reflected in consensus expectations, any shortfall in earnings delivery would lead to multiple contraction instead of upside protection, reducing returns even if operations remain solid.
This is below the 1-year historical P/E multiple of 67×, indicating the model prices in valuation normalization rather than continued multiple expansion.
What Happens If Things Go Better or Worse?
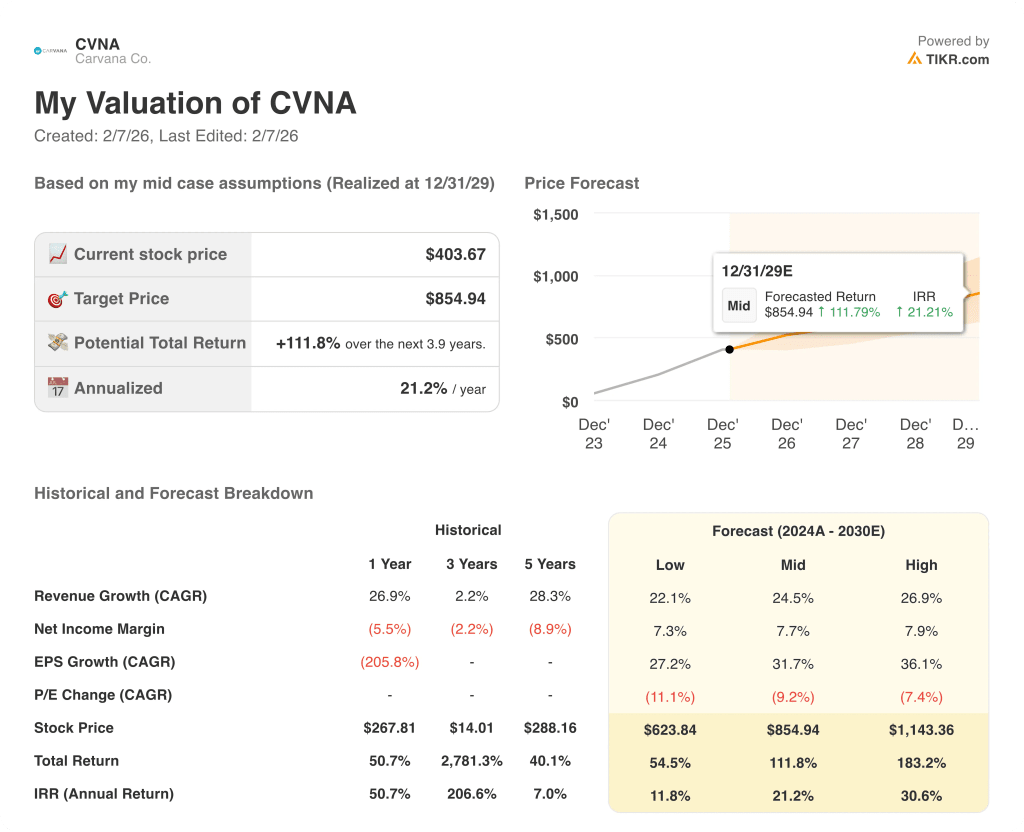
Carvana stock outcomes hinge on unit volume scaling, reconditioning throughput, and credit stability, creating a wide execution-driven range through 2029.
- Low Case: If demand normalizes and operational leverage plateaus, revenue grows around 22.1% and margins hold near 7.3% → 11.8% annualized return.
- Mid Case: With core execution holding and capacity scaling steadily, revenue growth near 24.5% and margins improving toward 7.7% → 21.2% annualized return.
- High Case: If share gains accelerate and cost discipline tightens, revenue reaches about 26.9% and margins approach 7.9% → 30.6% annualized return.
How Much Upside Does Carvana Stock Have From Here?
With TIKR’s new Valuation Model tool, you can estimate a stock’s potential share price in under a minute.
All it takes is three simple inputs:
- Revenue Growth
- Operating Margins
- Exit P/E multiple
If you’re not sure what to enter, TIKR automatically fills in each input using analysts’ consensus estimates, giving you a quick, reliable starting point.
From there, TIKR calculates the potential share price and total returns under Bull, Base, and Bear scenarios so you can quickly see whether a stock looks undervalued or overvalued.
Looking for New Opportunities?
- See what stocks billionaire investors are buying so you can follow the smart money.
- Analyze stocks in as little as 5 minutes with TIKR’s all-in-one, easy-to-use platform.
- The more rocks you overturn… the more opportunities you’ll uncover. Search 100K+ global stocks, global top investor holdings, and more with TIKR.
Disclaimer:
Please note that the articles on TIKR are not intended to serve as investment or financial advice from TIKR or our content team, nor are they recommendations to buy or sell any stocks. We create our content based on TIKR Terminal’s investment data and analysts’ estimates. Our analysis might not include recent company news or important updates. TIKR has no position in any stocks mentioned. Thank you for reading, and happy investing!