
Key Stats for Broadridge Stock
- Price Change: -6.0%
- Current Price: ~$182
- Advanced Model Target: $269
Now Live: Discover how much upside your favorite stocks could have using TIKR’s new Valuation Model (It’s free)>>>
What Happened?
Shares of Broadridge Financial Solutions, Inc. (BR) fell 6.0% to close near $182 on Friday, hitting a new 52-week low as investors sold the news following the company’s fiscal second-quarter report.
During the earnings call, CEO Tim Gokey reiterated the company’s full-year guidance, projecting recurring revenue growth of 8%.
However, the “status quo” outlook was not enough to satisfy growth-hungry investors.
Furthermore, analysts at DA Davidson maintained their Buy rating, emphasizing that the company’s backlog of closed sales remains at record levels
This sets the stage for accelerating growth in the second half of the fiscal year.
The disconnect between the steady operational performance and the plummeting stock price suggests a classic “baby out with the bathwater” scenario.
See analysts’ growth forecasts and price targets for Broadridge stock (It’s free!) >>>
Is Broadridge Undervalued Today?
During the UBS Financial Services Conference, CEO Tim Gokey directly addressed the company’s valuation and long-term growth model, framing current market fears as opportunities.
Gokey also strongly pushed back on the narrative that tokenization presents a disruption risk, asserting: “We see the vast majority of those are going to be purchased through a broker-dealer or through a digital trading platform. And those intermediaries are going to have the same asset servicing obligations that they have today.”
To reinforce the stability of the business, he reiterated the financial model: “More importantly, we’re on track to deliver a strong fiscal ’26 with recurring revenue growth constant currency at the higher end of 5% to 7% and adjusted EPS growth of 9% to 12%. “
Regarding sales momentum, despite being slightly behind year-to-date, Gokey highlighted a key leading indicator: ” In addition, new pipeline generation, which is our measure of new sales opportunities, rose more than 20% over the first half of fiscal ’25 driven in part by the transformational opportunities I just mentioned.” This provides confidence in the full-year outlook.
Read the full Broadridge Transcript on TIKR to see the 2026 Outlook >>>
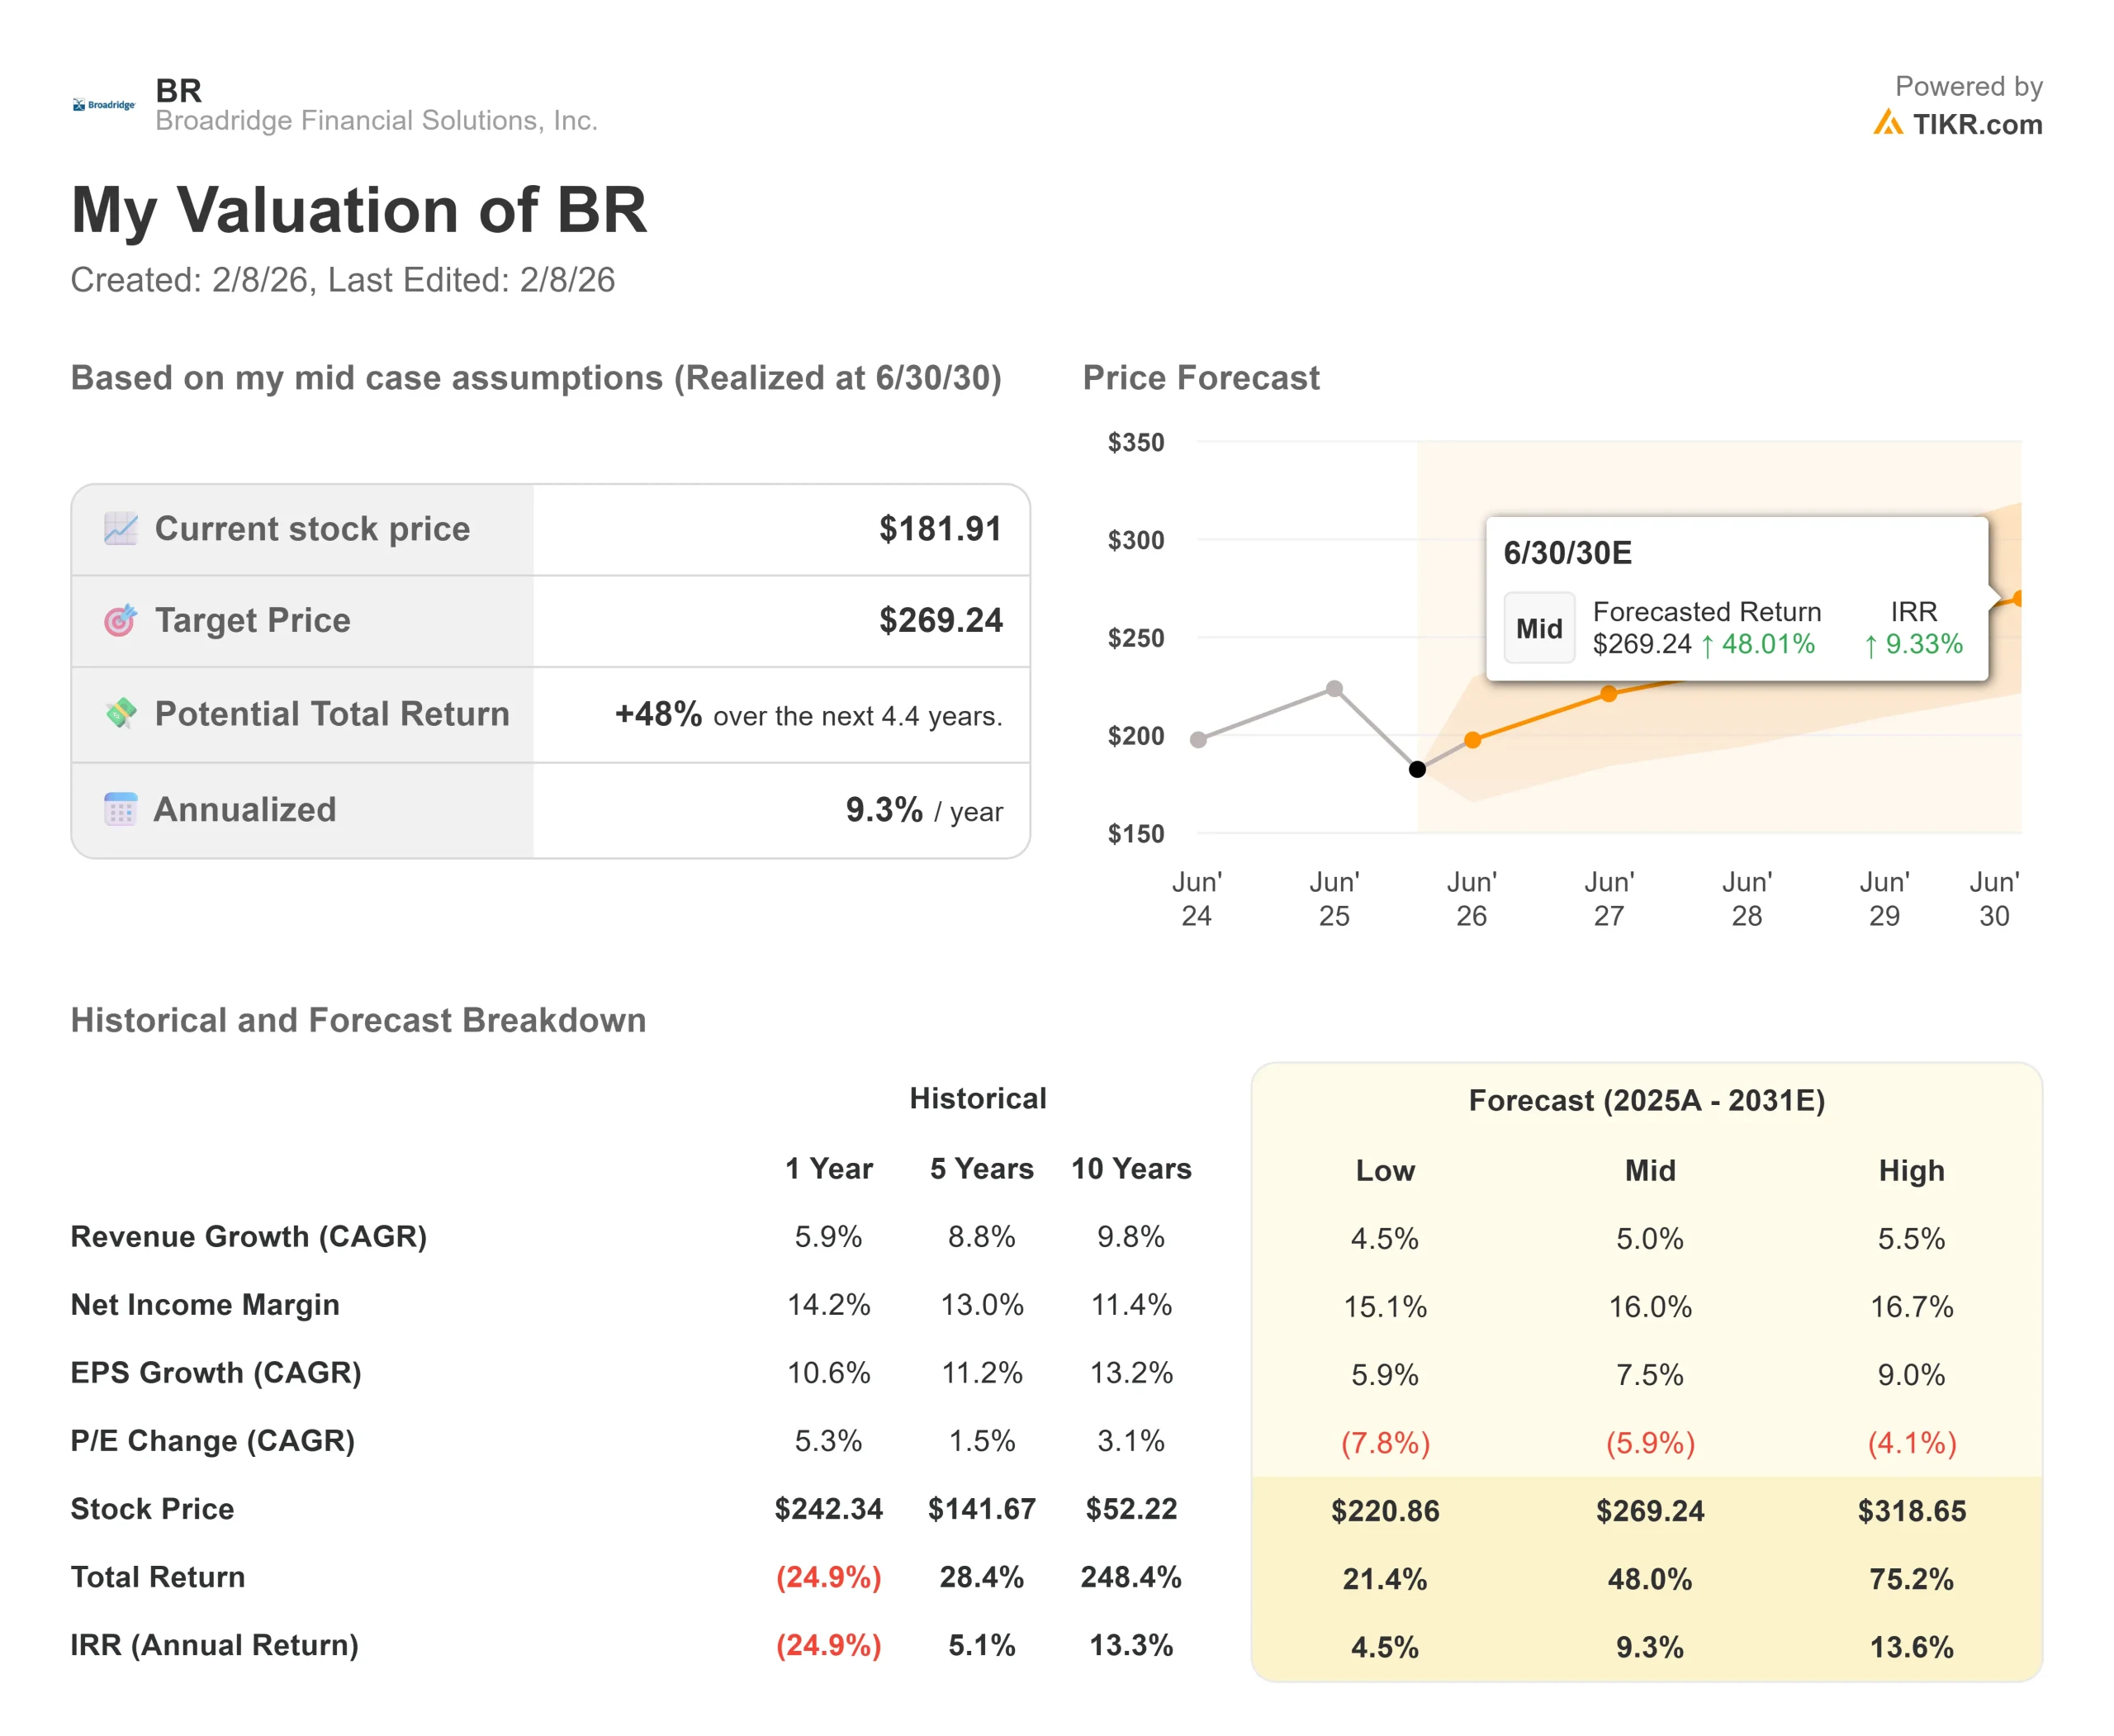
According to TIKR’s Advanced Valuation Model, the stock is now trading at a massive discount to its fair value.
- Target Price: $269
- Current Price: ~$182
- Potential Upside: +48.0%
Valuation Deep Dive
With the stock trading at ~$182, the market is pricing in a permanent stagnation that contradicts the company’s history of 50+ years of growth.
- The Moat: Broadridge processes over 80% of the proxy votes in North America, a monopoly-like position that provides incredibly sticky revenue.
- The Margin Expansion: The model forecasts Net Income Margins expanding to 16.0% over the next 5 years as the company scales its digital solutions.
- The Value Gap: The $269 target is based on a return to historical valuation multiples, which the stock has deviated from significantly during this correction.
If Broadridge can deliver on its second-half acceleration promise, the re-rating to $269 should be driven by a return of confidence in its “steady compounder” status.
Conclusion: A 52-week low opportunity. With a 48.0% upside potential to $269, Broadridge offers a compelling entry point for dividend growth investors looking to buy a high-quality infrastructure play at a “fire sale” price.
See what stocks billionaire investors are buying so you can follow the smart money with TIKR.he new “Space Prime” potential? [Click here to see the full Valuation Model for Intuitive Machines.]
How Much Upside Does Broadridge Stock Have From Here?
With TIKR’s new Valuation Model tool, you can estimate a stock’s potential share price in under a minute.
All it takes is three simple inputs:
- Revenue Growth
- Operating Margins
- Exit P/E Multiple
If you’re not sure what to enter, TIKR automatically fills in each input using analysts’ consensus estimates, giving you a quick, reliable starting point.
From there, TIKR calculates the potential share price and total returns under Bull, Base, and Bear scenarios so you can quickly see whether a stock looks undervalued or overvalued.
See a stock’s true value in under 60 seconds (Free with TIKR) >>>
Looking for New Opportunities?
- See what stocks billionaire investors are buying so you can follow the smart money.
- Analyze stocks in as little as 5 minutes with TIKR’s all-in-one, easy-to-use platform.
- The more rocks you overturn… the more opportunities you’ll uncover. Search 100K+ global stocks, global top investor holdings, and more with TIKR.
Disclaimer:
Please note that the articles on TIKR are not intended to serve as investment or financial advice from TIKR or our content team, nor are they recommendations to buy or sell any stocks. We create our content based on TIKR Terminal’s investment data and analysts’ estimates. Our analysis might not include recent company news or important updates. TIKR has no position in any stocks mentioned. Thank you for reading, and happy investing!