
Key Takeaways:
- Leadership Transition: Lululemon is shifting to an interim co-CEO structure ahead of a CEO change on January 31, resetting accountability as the business targets a 2026 product inflection. Lululemon’s plan centers on faster merchandising cycles and tighter execution discipline.
- Staffing Model Shift: Lululemon moved its North America GEC to a full-time staffing model in January, impacting about 100 part-time roles and signaling a service-cost and quality tradeoff. Lululemon is prioritizing operational consistency during a margin-pressure year.
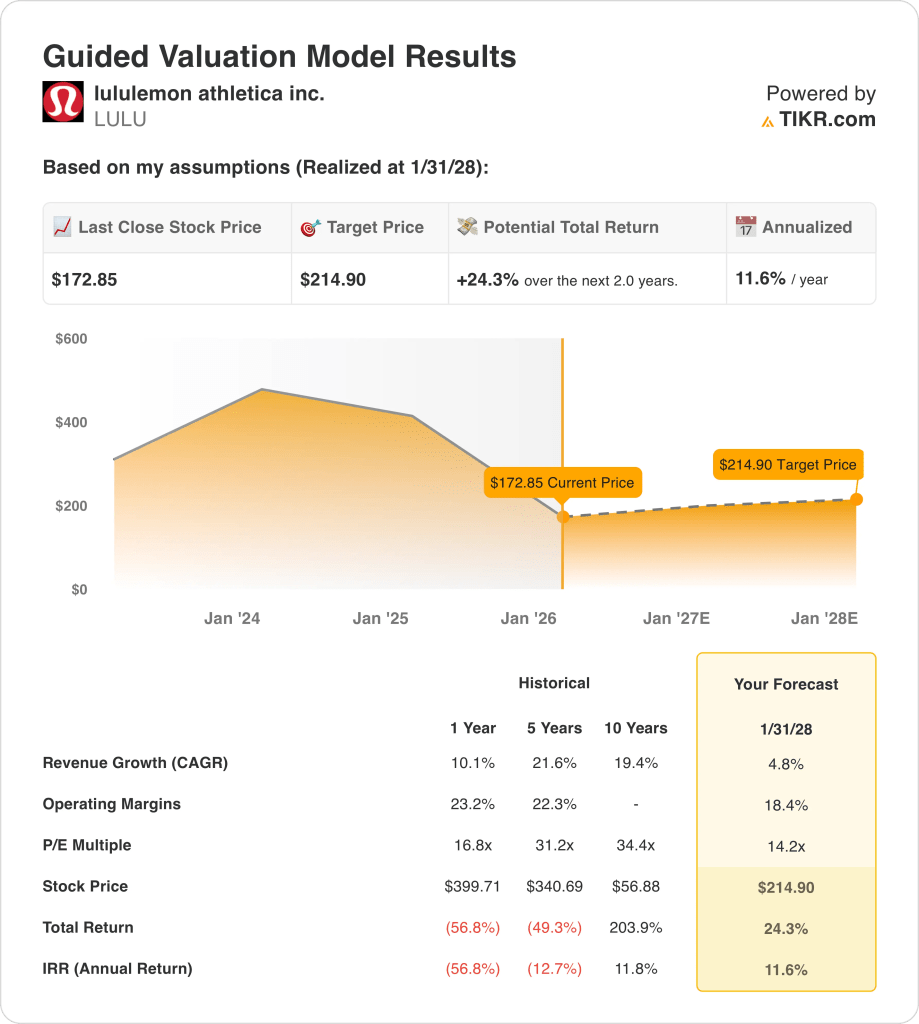
- Target Price Path: Based on 5% revenue growth, 18% operating margins, and a 14x exit P/E, Lululemon stock could reach $215 by January 2028. Lululemon’s upside case depends on product newness lifting full-price mix while tariffs and markdowns stay contained.
- Return Math: From $173 today, the $215 target implies 24% total upside over 2 years, reflecting 12% annualized returns. Lululemon’s valuation framework translates moderate growth and a lower multiple into a mid-teens compounding profile.
Lululemon athletica inc. (LULU) sells premium athletic apparel, footwear, and accessories across more than 30 geographies, supported by 796 stores and a digital channel that produced $1 billion, or 42%, of $3 billion quarterly revenue.
The business carries $11 billion of LTM revenue and $6 billion of gross profit, while $4 billion of operating expenses leave $2 billion of operating income and a 22% operating margin.
Lululemon Inc. is driving a 2026 assortment reset anchored to 35% new style penetration next spring, with CEO Calvin McDonald saying that their team “is working to reduce it to 12 to 14 months” from a 18 to 24 month development cycle.
The near-term backdrop includes a CEO transition on January 31 and a January shift to a full-time staffing model in the North America GEC that impacted about 100 part-time positions.
With the stock at $173, the model frames a 2-year outcome near $215 using 5% revenue growth, 18% operating margins, and a 14x P/E, versus a 31x 5-year multiple that sets the valuation debate.
What the Model Says for LULU Stock
Lululemon’s premium brand and capital-light structure support stable cash flows, keeping expectations anchored around an 18.4% margin profile.
The model assumes 4.8% revenue growth, 18.4% margins, and a 14.2x exit multiple, yielding a $214.90 target.
That outcome implies 24.3% total upside and an 11.6% annualized return, modestly exceeding diversified equity opportunity costs.
The model signals a conservative Buy, with an 11.6% annualized return exceeding disciplined equity risk thresholds under restrained valuation assumptions.
An 11.6% annualized return exceeds a typical 10% equity hurdle, compensating risk and favoring capital appreciation over preservation, supporting a Buy grounded in conservative assumptions of 4.8% growth, 18.4% margins, and a 14.2x exit multiple.
Our Valuation Assumptions
TIKR’s Valuation Model lets you plug in your own assumptions for a company’s revenue growth, operating margins, and P/E multiple, and calculates the stock’s expected returns.
Here’s what we used for Lululemon stock:
1. Revenue Growth: 4.8%
Lululemon’s revenue has grown at 10.1% over the last year, but scale, category maturity, and U.S. demand softness constrain forward growth expectations.
Current performance reflects $11 billion of LTM revenue, international strength led by China, and slower Americas trends that limit near-term acceleration.
Sustaining 4.8% growth requires steady international expansion and modest U.S. stabilization, while weaker consumer demand or execution slippage would quickly pressure top-line expectations.
This is below the 1-year historical revenue growth of 10.1%, indicating a conservative assumption consistent with a maturing brand profile.
2. Operating Margins: 18.4%
Lululemon has delivered a 23.2% operating margin over the last year, supported by premium pricing, brand strength, and historically disciplined cost control.
Current execution faces tariff pressure, higher markdowns, and incremental reinvestment, which management has acknowledged will weigh on near-term profitability.
Maintaining an 18.4% margin depends on cost containment and improved full-price sell-through, while further discounting or cost inflation would pressure earnings disproportionately.
This is below the 1-year historical operating margin of 23.2%, indicating a conservative margin reset that embeds reinvestment and cost risk.
3. Exit P/E Multiple: 14.2x
The exit P/E multiple capitalizes terminal earnings and reflects what level of valuation the business can reasonably sustain at maturity.
At exit, the model already embeds 4.8% revenue growth and 18.4% margins, capturing scale benefits and efficiency without assuming structural improvement.
A 14.2x multiple assumes normalized sentiment and limited re-rating potential, while execution disappointment would lead to compression rather than offsetting upside.
This is below the 1-year historical P/E of 16.8x, indicating a conservative valuation stance that prioritizes durability over multiple expansion.
What Happens If Things Go Better or Worse?
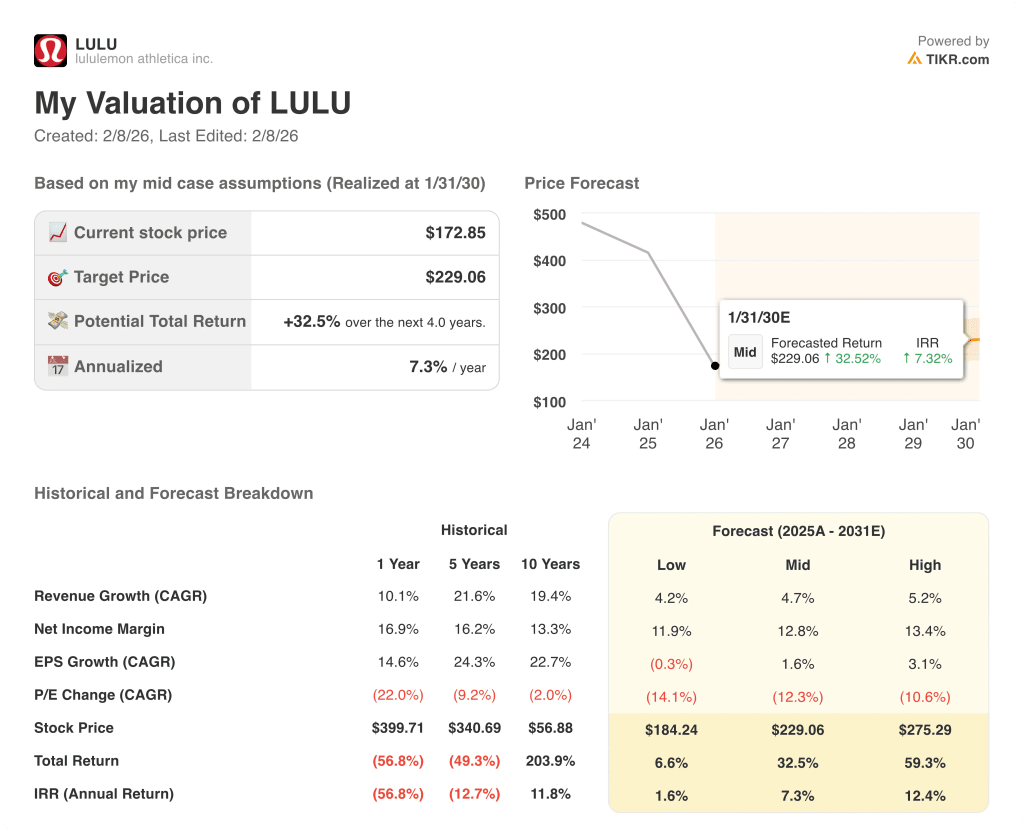
Lululemon’s equity performance hinges on brand relevance, U.S. demand normalization, and sustained cost control, shaping distinct execution paths through 2030.
- Low Case: If U.S. softness persists and costs remain elevated, revenue grows around 4.2% and margins stay near 11.9% → 1.6% annualized return.
- Mid Case: With core categories stabilizing and international growth offsetting U.S. pressure, revenue grows near 4.7% and margins improve toward 12.8% → 7.3% annualized return.
- High Case: If product refresh succeeds and pricing discipline holds, revenue reaches about 5.2% and margins approach 13.4% → 12.4% annualized return.
How Much Upside Does Lululemon Stock Have From Here?
With TIKR’s new Valuation Model tool, you can estimate a stock’s potential share price in under a minute.
All it takes is three simple inputs:
- Revenue Growth
- Operating Margins
- Exit P/E multiple
If you’re not sure what to enter, TIKR automatically fills in each input using analysts’ consensus estimates, giving you a quick, reliable starting point.
From there, TIKR calculates the potential share price and total returns under Bull, Base, and Bear scenarios so you can quickly see whether a stock looks undervalued or overvalued.
Looking for New Opportunities?
- See what stocks billionaire investors are buying so you can follow the smart money.
- Analyze stocks in as little as 5 minutes with TIKR’s all-in-one, easy-to-use platform.
- The more rocks you overturn… the more opportunities you’ll uncover. Search 100K+ global stocks, global top investor holdings, and more with TIKR.
Disclaimer:
Please note that the articles on TIKR are not intended to serve as investment or financial advice from TIKR or our content team, nor are they recommendations to buy or sell any stocks. We create our content based on TIKR Terminal’s investment data and analysts’ estimates. Our analysis might not include recent company news or important updates. TIKR has no position in any stocks mentioned. Thank you for reading, and happy investing!