
Key Takeaways:
- AI Infrastructure Momentum: Dell generated $27 billion of quarterly revenue and $12 billion of AI orders, building an $18 billion AI backlog and guiding to $111 billion for the year.
- Supply Chain And PC Refresh: Dell is qualifying alternative DRAM supply as memory tightness persists into 2026, while targeting a Windows upgrade pool of 500 million PCs across a 1.5 billion installed base.
- Price Target Framework: Based on 12% revenue growth, 9% operating margins, and a 10x P/E, Dell stock could reach $155 by January 2028.
- Modeled Upside Math: From $121 today, the $155 target implies 28% total upside and a 13% annualized return over 2 years.
Dell Technologies Inc. (DELL) sells PCs, servers, storage, networking, and services to enterprises and consumers, with revenue tied to hardware cycles plus attach-driven support and financing.
Over the last twelve months, Dell generated $104 billion of revenue, $22 billion of gross profit, $14 billion of operating expenses, and $8 billion of operating income, translating to an 8% operating margin.
Management is leaning into AI infrastructure growth and execution discipline after $27 billion quarterly revenue and 11% growth, while ISG margin expanded 360 basis points from 9% to 12%.
Dell CEO, Jeff Clarke said last December, “our differentiation starts with the engineering side,” citing 24 to 36 hour deployment timelines and 99% uptime as justification for premium pricing.
At $121, analysts are weighing whether 12% growth and 9% margins justify a 10x exit multiple and a $155 valuation path.
What the Model Says for DELL Stock
Dell’s extensive hardware footprint, accelerating AI infrastructure demand, and sustained cost discipline raise performance expectations, even as the business remains capital intensive.
By construction, the model embeds 11.8% revenue growth, 8.6% operating margins, and a 10.4x exit multiple, translating these assumptions into a $155.39 target price.
As a result, the projected 28.4% total upside and 13.4% annualized return clear the opportunity cost faced by diversified equity investors.
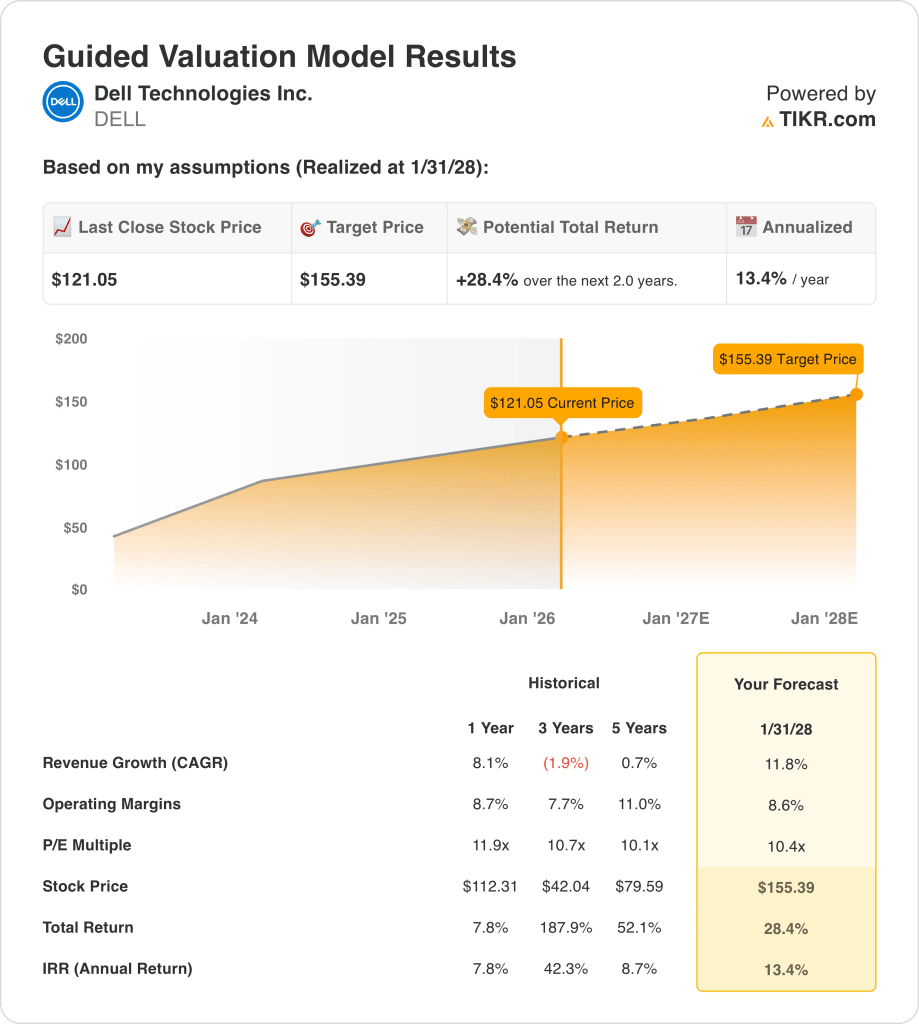
Therefore, the model issues a Buy signal, since a 13.4% annualized return adequately compensates for equity risk within the modeled assumptions.
Measured against a typical 10% equity hurdle, the 13.4% annualized return rewards risk, emphasizes capital appreciation over preservation, and supports a Buy grounded in disciplined valuation logic and execution-linked cash generation.
Our Valuation Assumptions
TIKR’s Valuation Model lets you plug in your own assumptions for a company’s revenue growth, operating margins, and P/E multiple, and calculates the stock’s expected returns.
Here’s what we used for Dell stock:
1. Revenue Growth: 11.8%
Dell’s revenue history reflects cyclical hardware demand, with a 1-year growth rate of 8.1% shaped by enterprise refresh timing and uneven PC recovery.
Current execution is supported by AI server backlog conversion, improving enterprise demand visibility, and stabilization across commercial PCs and infrastructure shipments.
Sustaining this pace requires consistent AI deployments, steady enterprise spending, and avoidance of renewed contraction in client devices or storage demand.
According to consensus analyst estimates, any shortfall in enterprise demand or AI shipment timing would pressure revenue quickly, compressing returns as growth assumptions compound, and this is above the 1-year historical revenue growth of 8.1%, indicating the model assumes renewed acceleration rather than cycle normalization.
2. Operating Margins: 8.6%
Dell stock’s operating margins have historically fluctuated with mix and cost control, with a 1-year operating margin of 8.7 reflecting recent efficiency gains.
Margin support currently comes from higher AI server mix, disciplined operating expenses, and incremental scale benefits within Infrastructure Solutions Group.
Maintaining margins depends on pricing discipline, stable component costs, and continued cost control amid competitive pressure and reinvestment needs.
As reflected in consensus expectations, modest execution slippage or cost inflation would erode margins before revenue adjusts, weakening valuation support, and this is below the 1-year historical operating margin of 8.7%, indicating the model assumes slight margin compression rather than expansion.
3. Exit P/E Multiple: 10.4x
Dell’s valuation has reflected mature hardware economics, with a 1-year P/E multiple of 11.9 anchored in stable earnings and limited growth expectations.
The model capitalizes normalized earnings after margin recovery and scale benefits, assuming durable cash generation without incremental optimism.
Based on street consensus estimates, earnings disappointment would drive multiple compression rather than upside expansion, reducing returns despite solid operations, and this is below the 1-year historical P/E multiple of 11.9, indicating the model assumes valuation normalization rather than re-rating.
What Happens If Things Go Better or Worse?
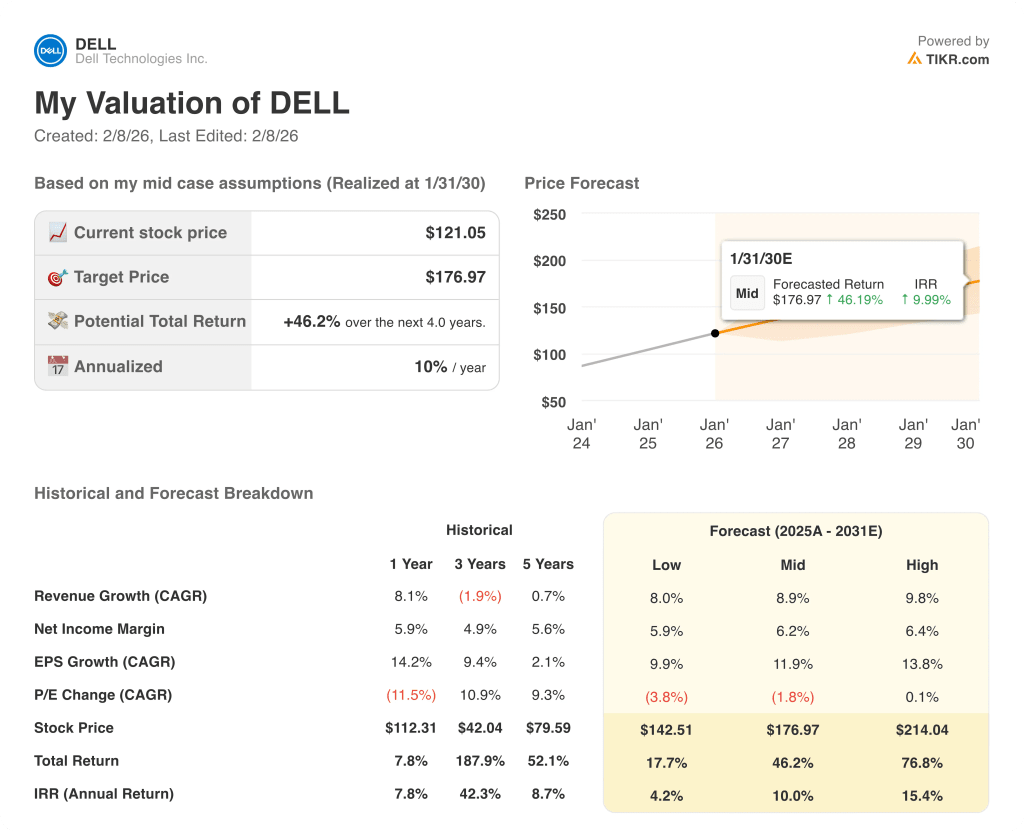
Dell stock outcomes depend on enterprise infrastructure demand, AI server execution, PC refresh timing, and cost discipline, shaping results through 2030.
- Low Case: If enterprise spending softens and PCs recover slowly, revenue grows around 8.0% and margins stay near 5.9% → 4.2% annualized return.
- Mid Case: With AI servers scaling steadily and PCs stabilizing, revenue growth near 8.9% and margins improving toward 6.2% → 10.0% annualized return.
- High Case: If AI backlog converts efficiently and cost control tightens, revenue reaches about 9.8% and margins approach 6.4% → 15.4% annualized return.
How Much Upside Does Dell Stock Have From Here?
With TIKR’s new Valuation Model tool, you can estimate a stock’s potential share price in under a minute.
All it takes is three simple inputs:
- Revenue Growth
- Operating Margins
- Exit P/E multiple
If you’re not sure what to enter, TIKR automatically fills in each input using analysts’ consensus estimates, giving you a quick, reliable starting point.
From there, TIKR calculates the potential share price and total returns under Bull, Base, and Bear scenarios so you can quickly see whether a stock looks undervalued or overvalued.
Looking for New Opportunities?
- See what stocks billionaire investors are buying so you can follow the smart money.
- Analyze stocks in as little as 5 minutes with TIKR’s all-in-one, easy-to-use platform.
- The more rocks you overturn… the more opportunities you’ll uncover. Search 100K+ global stocks, global top investor holdings, and more with TIKR.
Disclaimer:
Please note that the articles on TIKR are not intended to serve as investment or financial advice from TIKR or our content team, nor are they recommendations to buy or sell any stocks. We create our content based on TIKR Terminal’s investment data and analysts’ estimates. Our analysis might not include recent company news or important updates. TIKR has no position in any stocks mentioned. Thank you for reading, and happy investing!