


Key Takeaways for Braze Stock as of September 2026
- Broad-Based Beat: Revenue of $227.23M beat Street by 3.16%, and adjusted EPS of $0.19 topped estimates by 22.20%.
- Double Guidance Raise: Q3 revenue guidance rose to $229M-$230M (~20% YoY) and full-year revenue guidance climbed to $910M-$913M (~23% YoY), with full-year operating income guided higher to $75.5M-$76.5M for fiscal 2027.
- Margin Inflection: EBIT beat estimates by 24.27% as operating margin hit 9.7% of revenue, up from 3.4% a year ago, while free cash flow set a Q2 record of $22M against $4M last year.
- Magnuson on the Quarter: Operating margin improved ~600bps YoY on 26% revenue growth to $227 million.
Braze Stock Rides a Profitability Inflection as Q2 Margins Nearly Double
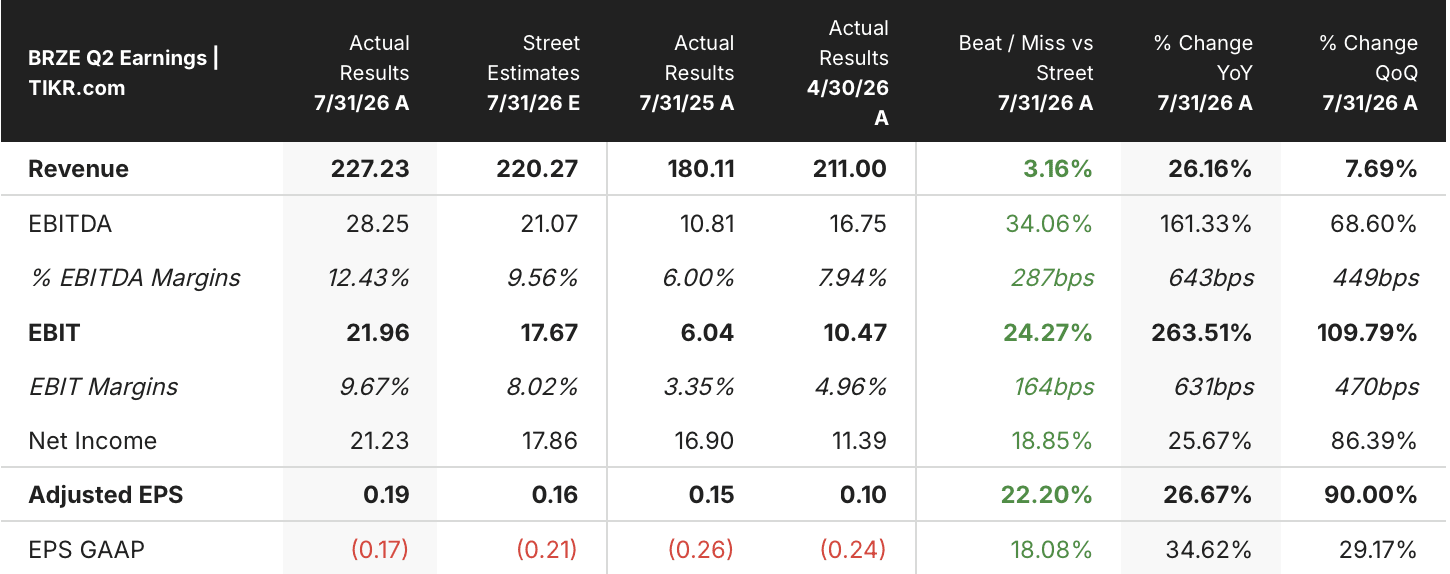
Braze (BRZE) stock is trading at $28.75 as of Wednesday, September 9, down 5% from the $30.31 close it posted before its fiscal second-quarter results came out after Tuesday’s bell. The stock fell as much as 13% in after-hours trading once the report hit, then recovered most of that ground once regular trading resumed. The moves came despite a broad beat across nearly every line management reported: EBIT of $21.96 million cleared estimates by 24.27%, and adjusted EPS of $0.19 topped the $0.16 estimate by 22.20%.
Non-GAAP operating income reached $22 million, or 9.7% of revenue, up from 3.4% a year ago when the company earned just $6 million on similar scale. Total opex fell to 58.9% of revenue from 66% in the prior-year quarter, and that discipline showed up directly in cash: Braze generated a record second-quarter free cash flow of $22 million, more than five times the $4 million produced a year earlier. CFO Pankaj Malik pointed to the same trend when he broke down cash from operations, which climbed to $24 million from $7 million.
Growth in the highest-value customer cohort kept pace with the margin story. Customers spending at least $500,000 annually rose 28% year over year to 361, now contributing 65% of total ARR versus 62% a year ago, and trailing 12-month net retention for that cohort ticked up to 112% from 111% in the prior quarter. Total customer count grew a slower 15% to 2,789, a gap that puts the company’s growth increasingly in the hands of fewer, larger accounts rather than broad account additions.
That reliance on large accounts came with a cost line worth watching. Non-GAAP gross margin slipped to 68.6% from 69.3% a year ago, a decline CFO Pankaj Malik attributed on the Q2 earnings call to “high premium messaging volumes and the addition of Decisioning Studio headcount attributable to cost of revenue.” Even with that pressure, management raised the full-year operating income guide to $75.5 million to $76.5 million and lifted full-year revenue guidance to $910 million to $913 million, 23% growth at the midpoint.
Braze closed its $50 million accelerated share repurchase program in August, buying back 2.1 million shares. $50 million remains on the board’s authorization, and the balance sheet carries $414 million in cash and marketable securities heading into the back half of fiscal 2027.
TIKR Values Braze Stock at $60, Pricing In the Margin Trajectory
TIKR’s mid-case model values Braze stock at $60 by January 2031, implying 96% total return from the current price of $30, or 17% annualized over 4.4 years.

That 96% return, compounding at 17% annually, places Braze stock among software names priced for sustained growth alongside a structurally higher margin profile rather than one at the expense of the other.
The target is reachable because the second quarter’s operating leverage already shows up in the model’s assumptions: operating margin expanded to 9.7% of revenue while free cash flow reached a record $22 million, exactly the profitability inflection embedded in a $60 target. Management backed that trajectory with hard numbers, raising both revenue and operating income guidance for the full year rather than simply reiterating prior figures.
Should You Invest in Braze, Inc.?
The only way to really know is to look at the numbers yourself. TIKR gives you free access to the same institutional-quality financial data that professional analysts use to answer exactly that question.
Pull up Braze, Inc. stock and you’ll see years of historical financials, what Wall Street analysts expect for revenue and earnings in the quarters ahead, how valuation multiples have moved over time, and whether price targets are trending up or down.
You can build a free watchlist to track Braze, Inc. alongside every other stock on your radar. No credit card required. Just the data you need to decide for yourself.
Access Professional Tools to Analyze BRZE stock on TIKR for Free →
Looking for New Opportunities?
- See what stocks billionaire investors are buying so you can follow the smart money.
- Analyze stocks in as little as 5 minutes with TIKR’s all-in-one, easy-to-use platform.
- The more rocks you overturn… the more opportunities you’ll uncover. Search 100K+ global stocks, global top investor holdings, and more with TIKR.
Disclaimer:
Please note that the articles on TIKR are not intended to serve as investment or financial advice from TIKR or our content team, nor are they recommendations to buy or sell any stocks. We create our content based on TIKR Terminal’s investment data and analysts’ estimates. Our analysis might not include recent company news or important updates. TIKR has no position in any stocks mentioned. Thank you for reading, and happy investing!


