
Key Takeaways:
- Grid Under Strain: PJM hit a record demand peak of 168 gigawatts in July 2026, with power prices surging tenfold during the event, underscoring the case for new supply.
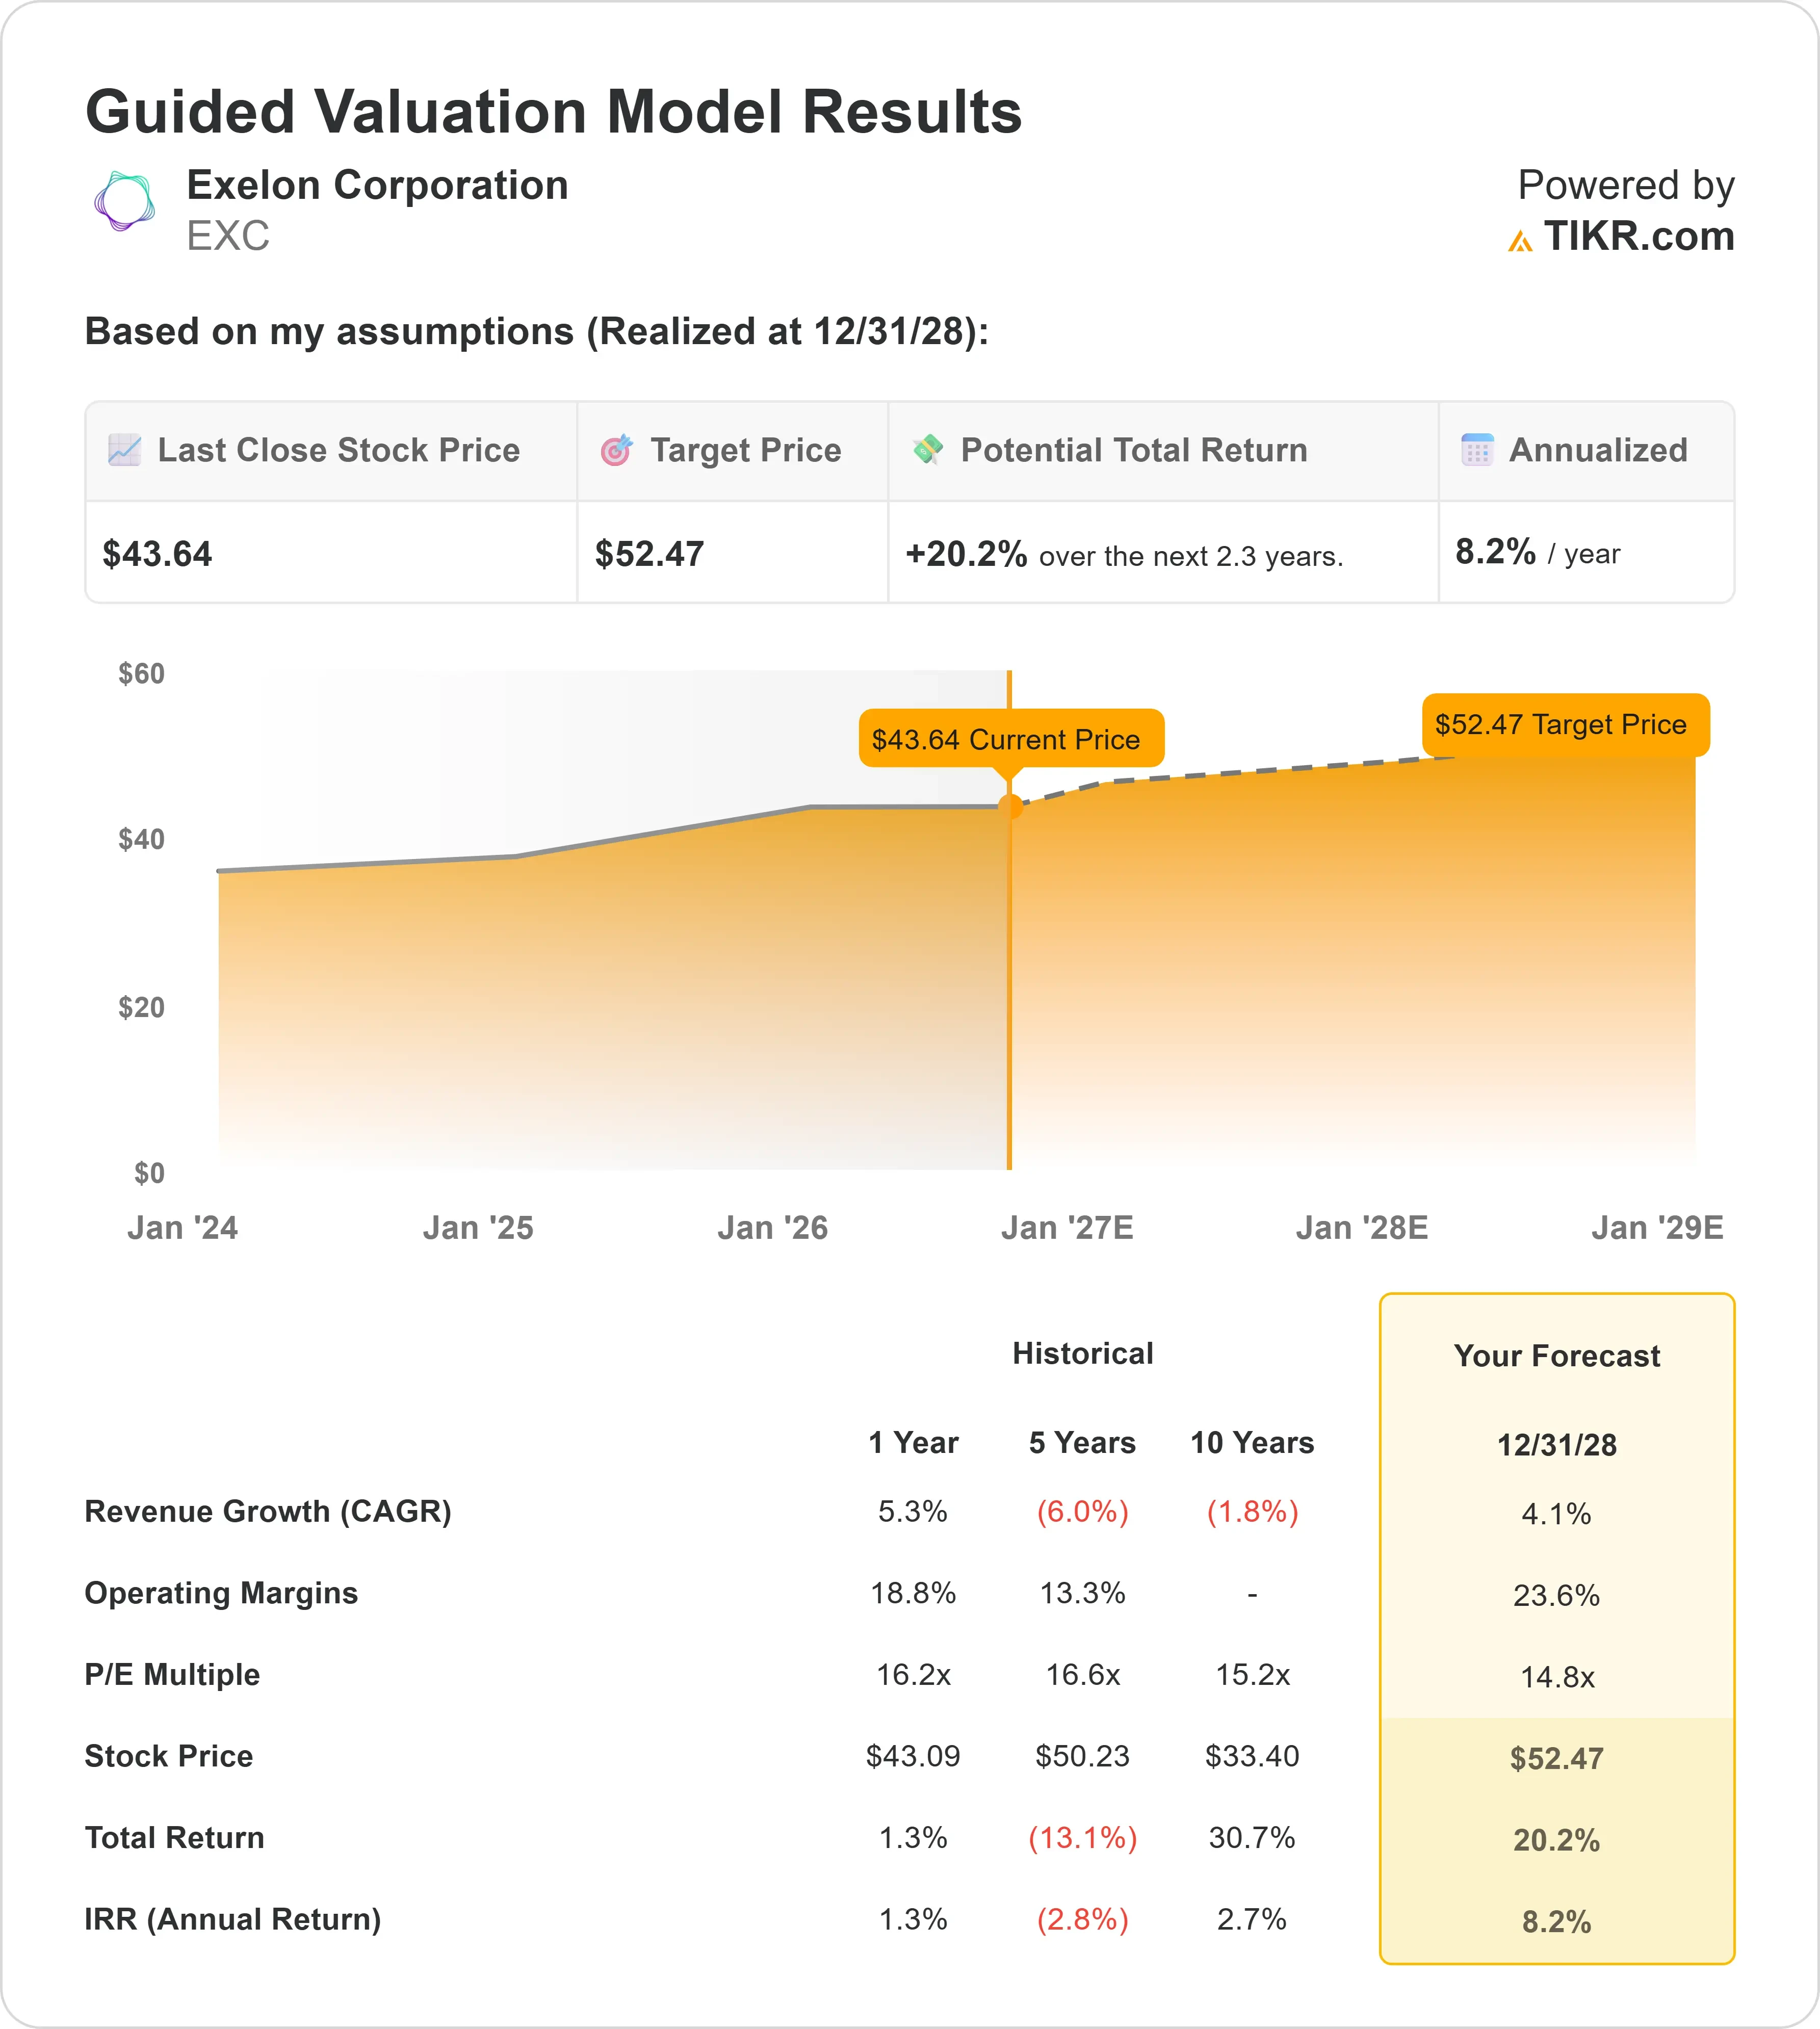
- Price Projection: Based on current execution, EXC stock could reach $52 by December 2028.
- Potential Gains: This target implies a total return of 20% from the current price of $44.
- Annual Return: Investors could see roughly 8% annualized growth over the next 2.3 years.
Now Live: Discover how much upside your favorite stocks could have using TIKR’s new Valuation Model (It’s free)>>>
Exelon (EXC) posted adjusted operating earnings of $0.43 per share in the Q2 of 2026, in line with expectations, and reaffirmed full-year guidance of $2.81 to $2.91 per share.
CEO Calvin Butler highlighted the company’s reliability track record, noting that all of Exelon’s utilities are projected to land in the top quartile for reliability nationally, with ComEd and Pepco Holdings in the top decile.
That mattered this year: ComEd faced 16 major weather events, more than in the past two decades combined, yet restored power to 90% of the 530,000 customers affected by a recent storm within 48 hours.
The bigger theme this quarter was grid strain. PJM’s most recent capacity auction cleared at the price cap for a third straight time, and still fell about 6.8 gigawatts short of what’s needed for reliability, a shortfall roughly equal to seven nuclear reactors of missing supply.
Exelon trades around $44 today, and management is leaning into new investments like battery storage to help close that gap.
See analysts’ full growth forecasts and estimates for EXC stock (It’s free) >>>
What the Model Says for Exelon Stock
Exelon is a pure-play regulated utility that delivers electricity and gas to customers across six states and Washington, D.C., through operating companies like ComEd, PECO, and BGE.
Its growth comes from rate base expansion, essentially getting regulators to approve investment in poles, wires, and substations, then earning a return on that spending.
Data center demand is a growing part of the story, though management has taken a cautious approach.
The company recently trimmed its data center pipeline estimate from 43 gigawatts to 36 gigawatts, but CFO Jeanne Jones said this reflects weeding out speculative projects rather than weakening demand.
Roughly 11 gigawatts of that pipeline is now considered high-probability, backed by signed Transmission Security Agreements and real collateral.
To address the supply shortfall PJM is facing, Exelon is pushing into battery storage. Its planned 500-megawatt project in New Jersey would be the largest battery installation in PJM, expected to deliver over $700 million in net customer benefits without affecting bills until at least 2035.
Using a forecast of 4.1% annual revenue growth and 23.6% operating margins, our model projects the stock could rise to $52 within 2.3 years. This assumes a 14.8x price-to-earnings multiple, below Exelon’s own one-year average of 16.2x.
Our Valuation Assumptions
Estimate a company’s fair value instantly (Free with TIKR) >>>
Our Valuation Assumptions
TIKR’s Valuation Model lets you plug in your own assumptions for a company’s revenue growth, operating margins, and P/E multiple, and calculates the stock’s expected returns.
Here’s what we used for Exelon stock:
1. Revenue Growth: 4.1%
Exelon grew revenue 5.3% over the full year of 2025, a turnaround from negative growth over the prior five and ten years as the company worked through divestitures following its 2022 generation spinoff.
Management is targeting annualized earnings growth near the top end of 5% to 7% through 2029, supported by 7.9% annualized rate base growth.
We’re assuming revenue growth settles near 4% as new transmission and data center-related investments phase in.
2. Operating margins: 23.6%
In 2025, operating margin sat at 21.0%, above the five- and ten-year averages of roughly 15-17%.
As a regulated utility, margins here largely reflect approved rate structures rather than competitive dynamics.
With multiple rate cases pending at Pepco Maryland, BGE, and Delmarva Power, we assume continued gradual margin improvement as investments are recovered through customer rates.
3. Exit P/E Multiple: 14.8x
EXC currently trades at 14.8x forward earnings, below its one-year, three-year, and five-year averages, all in the 15-17x range.
We’re holding the multiple roughly flat, reflecting the stable, defensive nature of regulated utility earnings, where dramatic re-rating in either direction is uncommon absent a major shift in growth expectations or interest rates.
Build your own Valuation Model to value any stock (It’s free!) >>>
What Happens If Things Go Better or Worse?
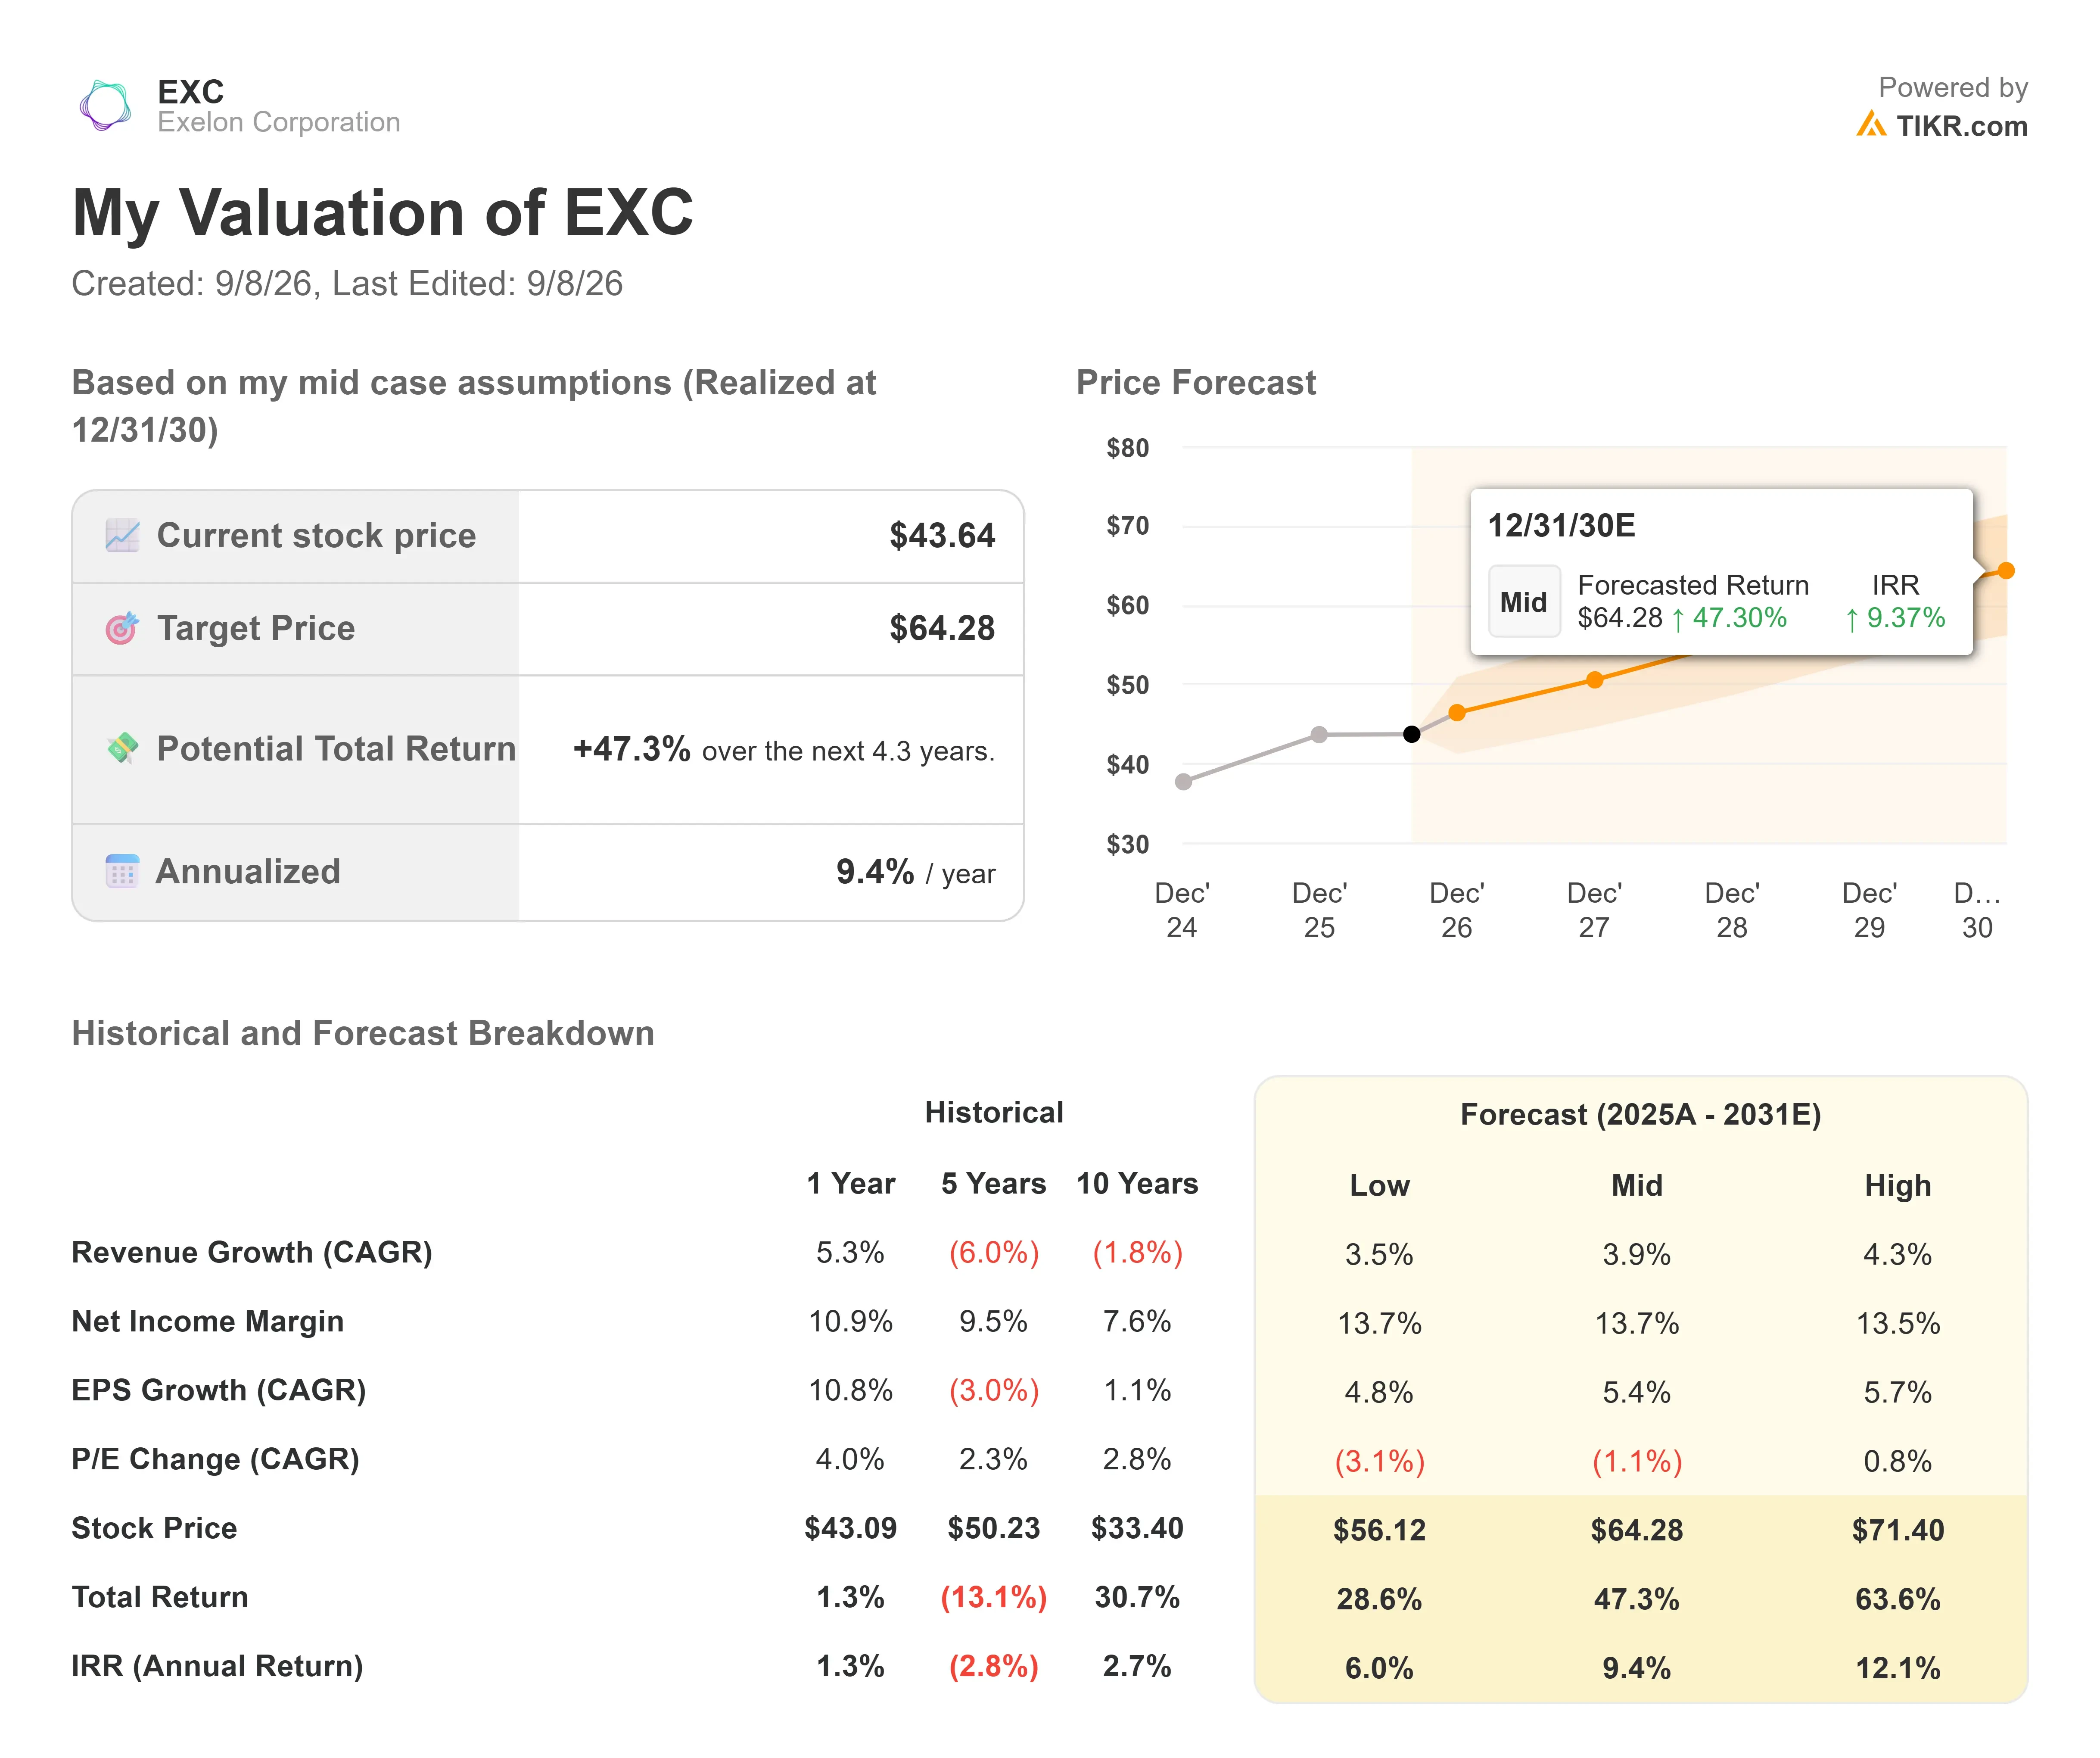
Utility stocks tend to move within a narrower band than growth companies, but regulatory outcomes and data center demand can still meaningfully shift results. Here’s how Exelon stock might perform under different scenarios through December 2030:
- Low Case: If revenue growth settles at 3.5% and net income margins come in at 13.7%, investors could still see a 28.6% total return, or about 6.0% annually.
- Mid Case: With 3.9% growth and 13.7% margins, we expect a total return of 47.3%, or roughly 9.4% annually.
- High Case: If data center demand converts faster than expected and PJM’s supply shortfall drives additional transmission and storage investment, revenue growth could reach 4.3% and margins 13.5%, pushing total returns to 63.6%, or about 12.1% annually.
See what analysts think about EXC stock right now (Free with TIKR) >>>
The spread between these outcomes largely depends on how much of Exelon’s data center pipeline converts into signed, collateralized agreements, and how favorably its pending rate cases in Maryland, Delaware, and Pennsylvania are resolved over the next two years.
How Much Upside Does Exelon Stock Have From Here?
With TIKR’s new Valuation Model tool, you can estimate a stock’s potential share price in under a minute.
All it takes is three simple inputs:
- Revenue Growth
- Operating Margins
- Exit P/E Multiple
If you’re not sure what to enter, TIKR automatically fills in each input using analysts’ consensus estimates, giving you a quick, reliable starting point.
From there, TIKR calculates the potential share price and total returns under Bull, Base, and Bear scenarios so you can quickly see whether a stock looks undervalued or overvalued.
See a stock’s true value in under 60 seconds (Free with TIKR) >>>
Looking for New Opportunities?
- See what stocks billionaire investors are buying so you can follow the smart money.
- Analyze stocks in as little as 5 minutes with TIKR’s all-in-one, easy-to-use platform.
- The more rocks you overturn… the more opportunities you’ll uncover. Search 100K+ global stocks, global top investor holdings, and more with TIKR.
Disclaimer:
Please note that the articles on TIKR are not intended to serve as investment or financial advice from TIKR or our content team, nor are they recommendations to buy or sell any stocks. We create our content based on TIKR Terminal’s investment data and analysts’ estimates. Our analysis might not include recent company news or important updates. TIKR has no position in any stocks mentioned. Thank you for reading, and happy investing!