Key Takeaways:
- Broad-Based Recovery: Texas Instruments saw growth across industrial, automotive, data center, and communications in Q2 2026, with data center revenue doubling year over year.
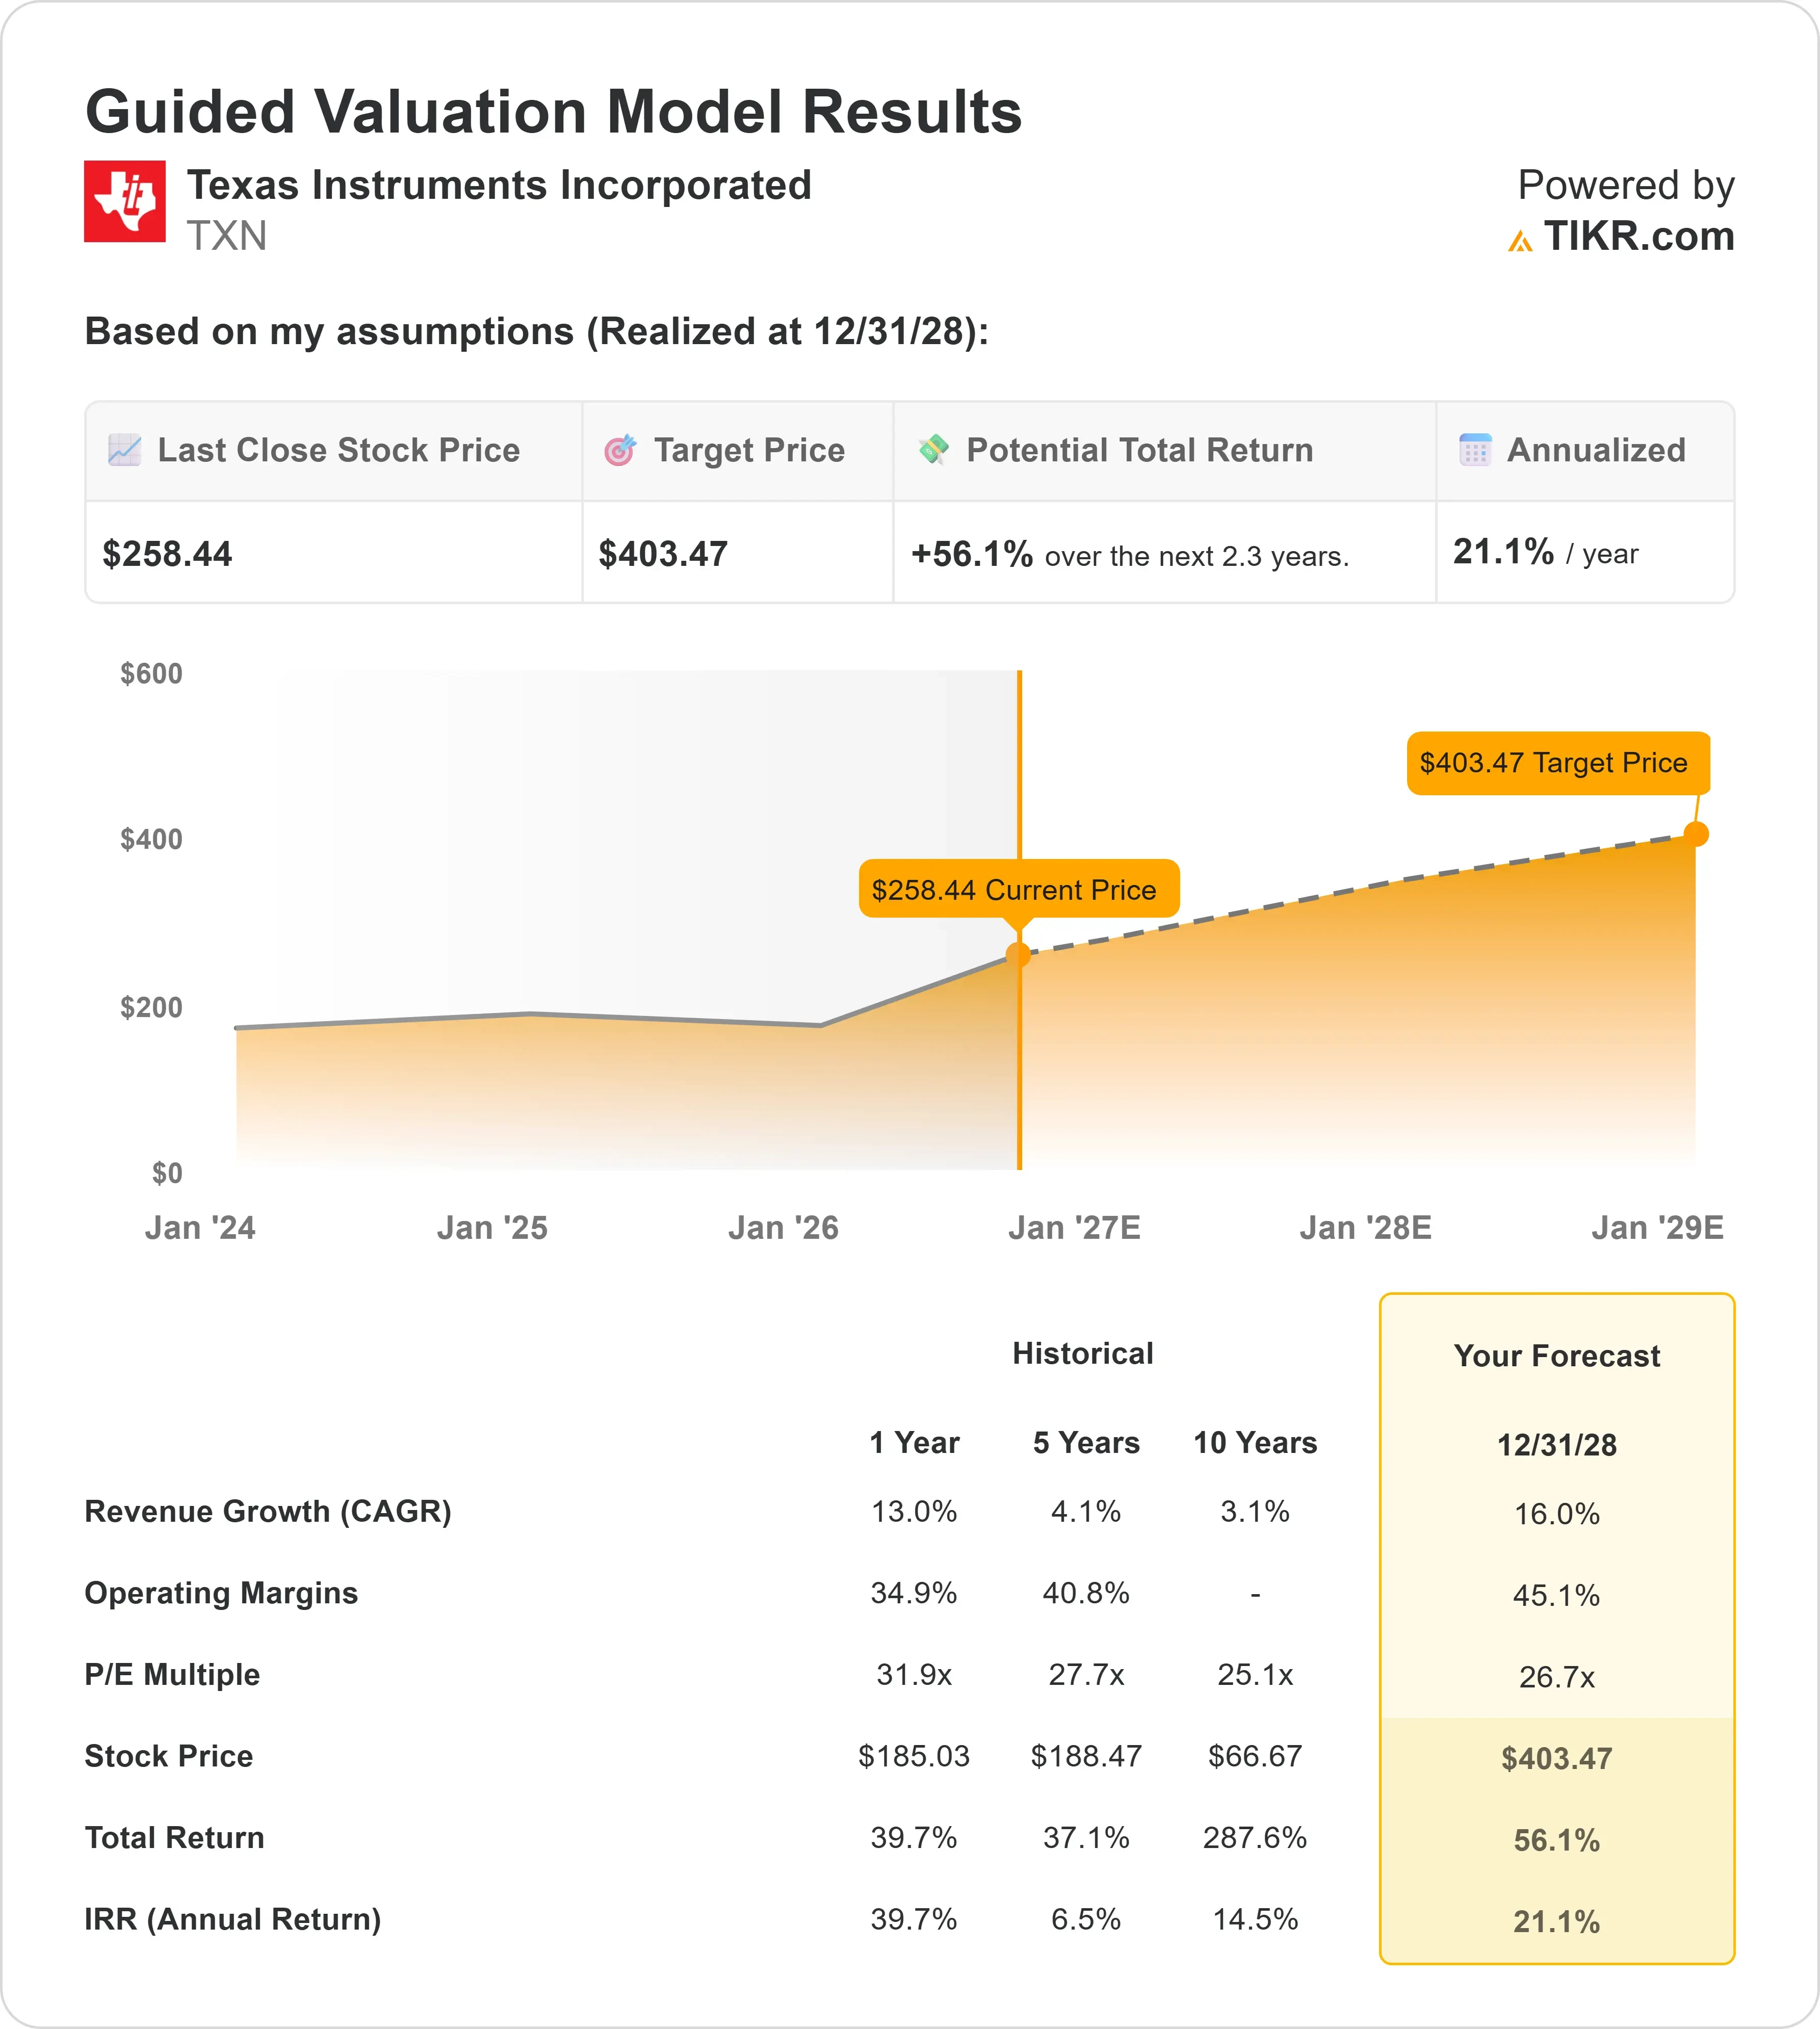
- Price Projection: Based on current execution, TXN stock could reach $403 by December 2028.
- Potential Gains: This target implies a total return of 56% from the current price of $258.
- Annual Return: Investors could see roughly 21% annualized growth over the next 2.3 years.
Now Live: Discover how much upside your favorite stocks could have using TIKR’s new Valuation Model (It’s free)>>>
Texas Instruments (TXN) delivered a strong Q2 of 2026, with revenue of $5.5 billion, up 23% year over year and 13% sequentially.
Both Analog and Embedded Processing segments grew, with Analog revenue up 26% and Embedded up 16%.
CEO Haviv Ilan said growth came in broad this time, not just from industrial and data center like recent quarters, but now automotive too.
Industrial revenue rose about 30% year over year, automotive grew mid-teens, and data center revenue doubled.
Operating margin came in at 42% for the quarter, and free cash flow over the trailing twelve months hit $6.5 billion, up sharply from $1.8 billion a year earlier.
The company also announced Julie Knecht will take over as CFO on August 1, succeeding longtime finance chief Rafael Lizardi.
TXN trades around $258 today, and management expects the current upcycle, driven by inventory restocking and new system designs, to continue into the second half of the year.
See analysts’ full growth forecasts and estimates for TXN stock (It’s free) >>>
What the Model Says for Texas Instruments Stock
Texas Instruments makes analog and embedded chips used across nearly every industry, from cars to factories to data centers.
Its main advantage right now is capacity. After years of building out manufacturing capacity, including new fabs in Sherman and Lehi, TI can meet demand faster than competitors still waiting for new capacity to come online.
Management pointed to data center demand doubling year over year as chips get used across power conversion stages, and said this trend should only grow as the industry shifts to more complex architectures like 800-volt systems.
Automotive demand also picked up unexpectedly in the quarter, driven partly by China EV and hybrid sales as customers work through previously depleted inventory.
TI is also starting to push through price increases for the first time in a while, though management says the impact on near-term results is small since most of the growth is coming from higher unit volumes, not price.
Using a forecast of 16.0% annual revenue growth and 45.1% operating margins, our model projects the stock could climb to $403 within 2.3 years. This assumes a 26.7x price-to-earnings multiple, below TXN’s own one-year average of 31.9x.
Our Valuation Assumptions
Estimate a company’s fair value instantly (Free with TIKR) >>>
Our Valuation Assumptions
TIKR’s Valuation Model lets you plug in your own assumptions for a company’s revenue growth, operating margins, and P/E multiple, and calculates the stock’s expected returns.
Here’s what we used for Texas Instruments stock:
1. Revenue Growth: 16.0%
Texas Instruments grew revenue 13% during the year ended in December 2025, a sharp turnaround from the negative growth seen over the prior two years as the industry worked through excess inventory.
With broad-based strength now showing up across industrial, automotive, and data center, and management describing the setup as “the start of a cycle that is very, very broad,” we’re assuming growth stays elevated near 16% as this recovery plays out.
2. Operating margins: 45.1%
For the year ended Dec-25, operating margin sits at 34.6%, below the five- and ten-year averages of around 41-42%.
Q2 2026 alone came in much higher at 42%, aided by 340 basis points of sequential gross margin expansion.
As factory utilization improves further and TI’s newer 300-millimeter fabs contribute more, we’re assuming margins climb back toward historical norms.
3. Exit P/E Multiple: 26.7x
TXN currently trades at 26.7x forward earnings, below its one-year and three-year averages of 31.9x.
We’re holding the multiple roughly flat rather than assuming further expansion, since a chip-cycle recovery this far along typically brings some multiple normalization even as earnings continue to grow.
Build your own Valuation Model to value any stock (It’s free!) >>>
What Happens If Things Go Better or Worse?
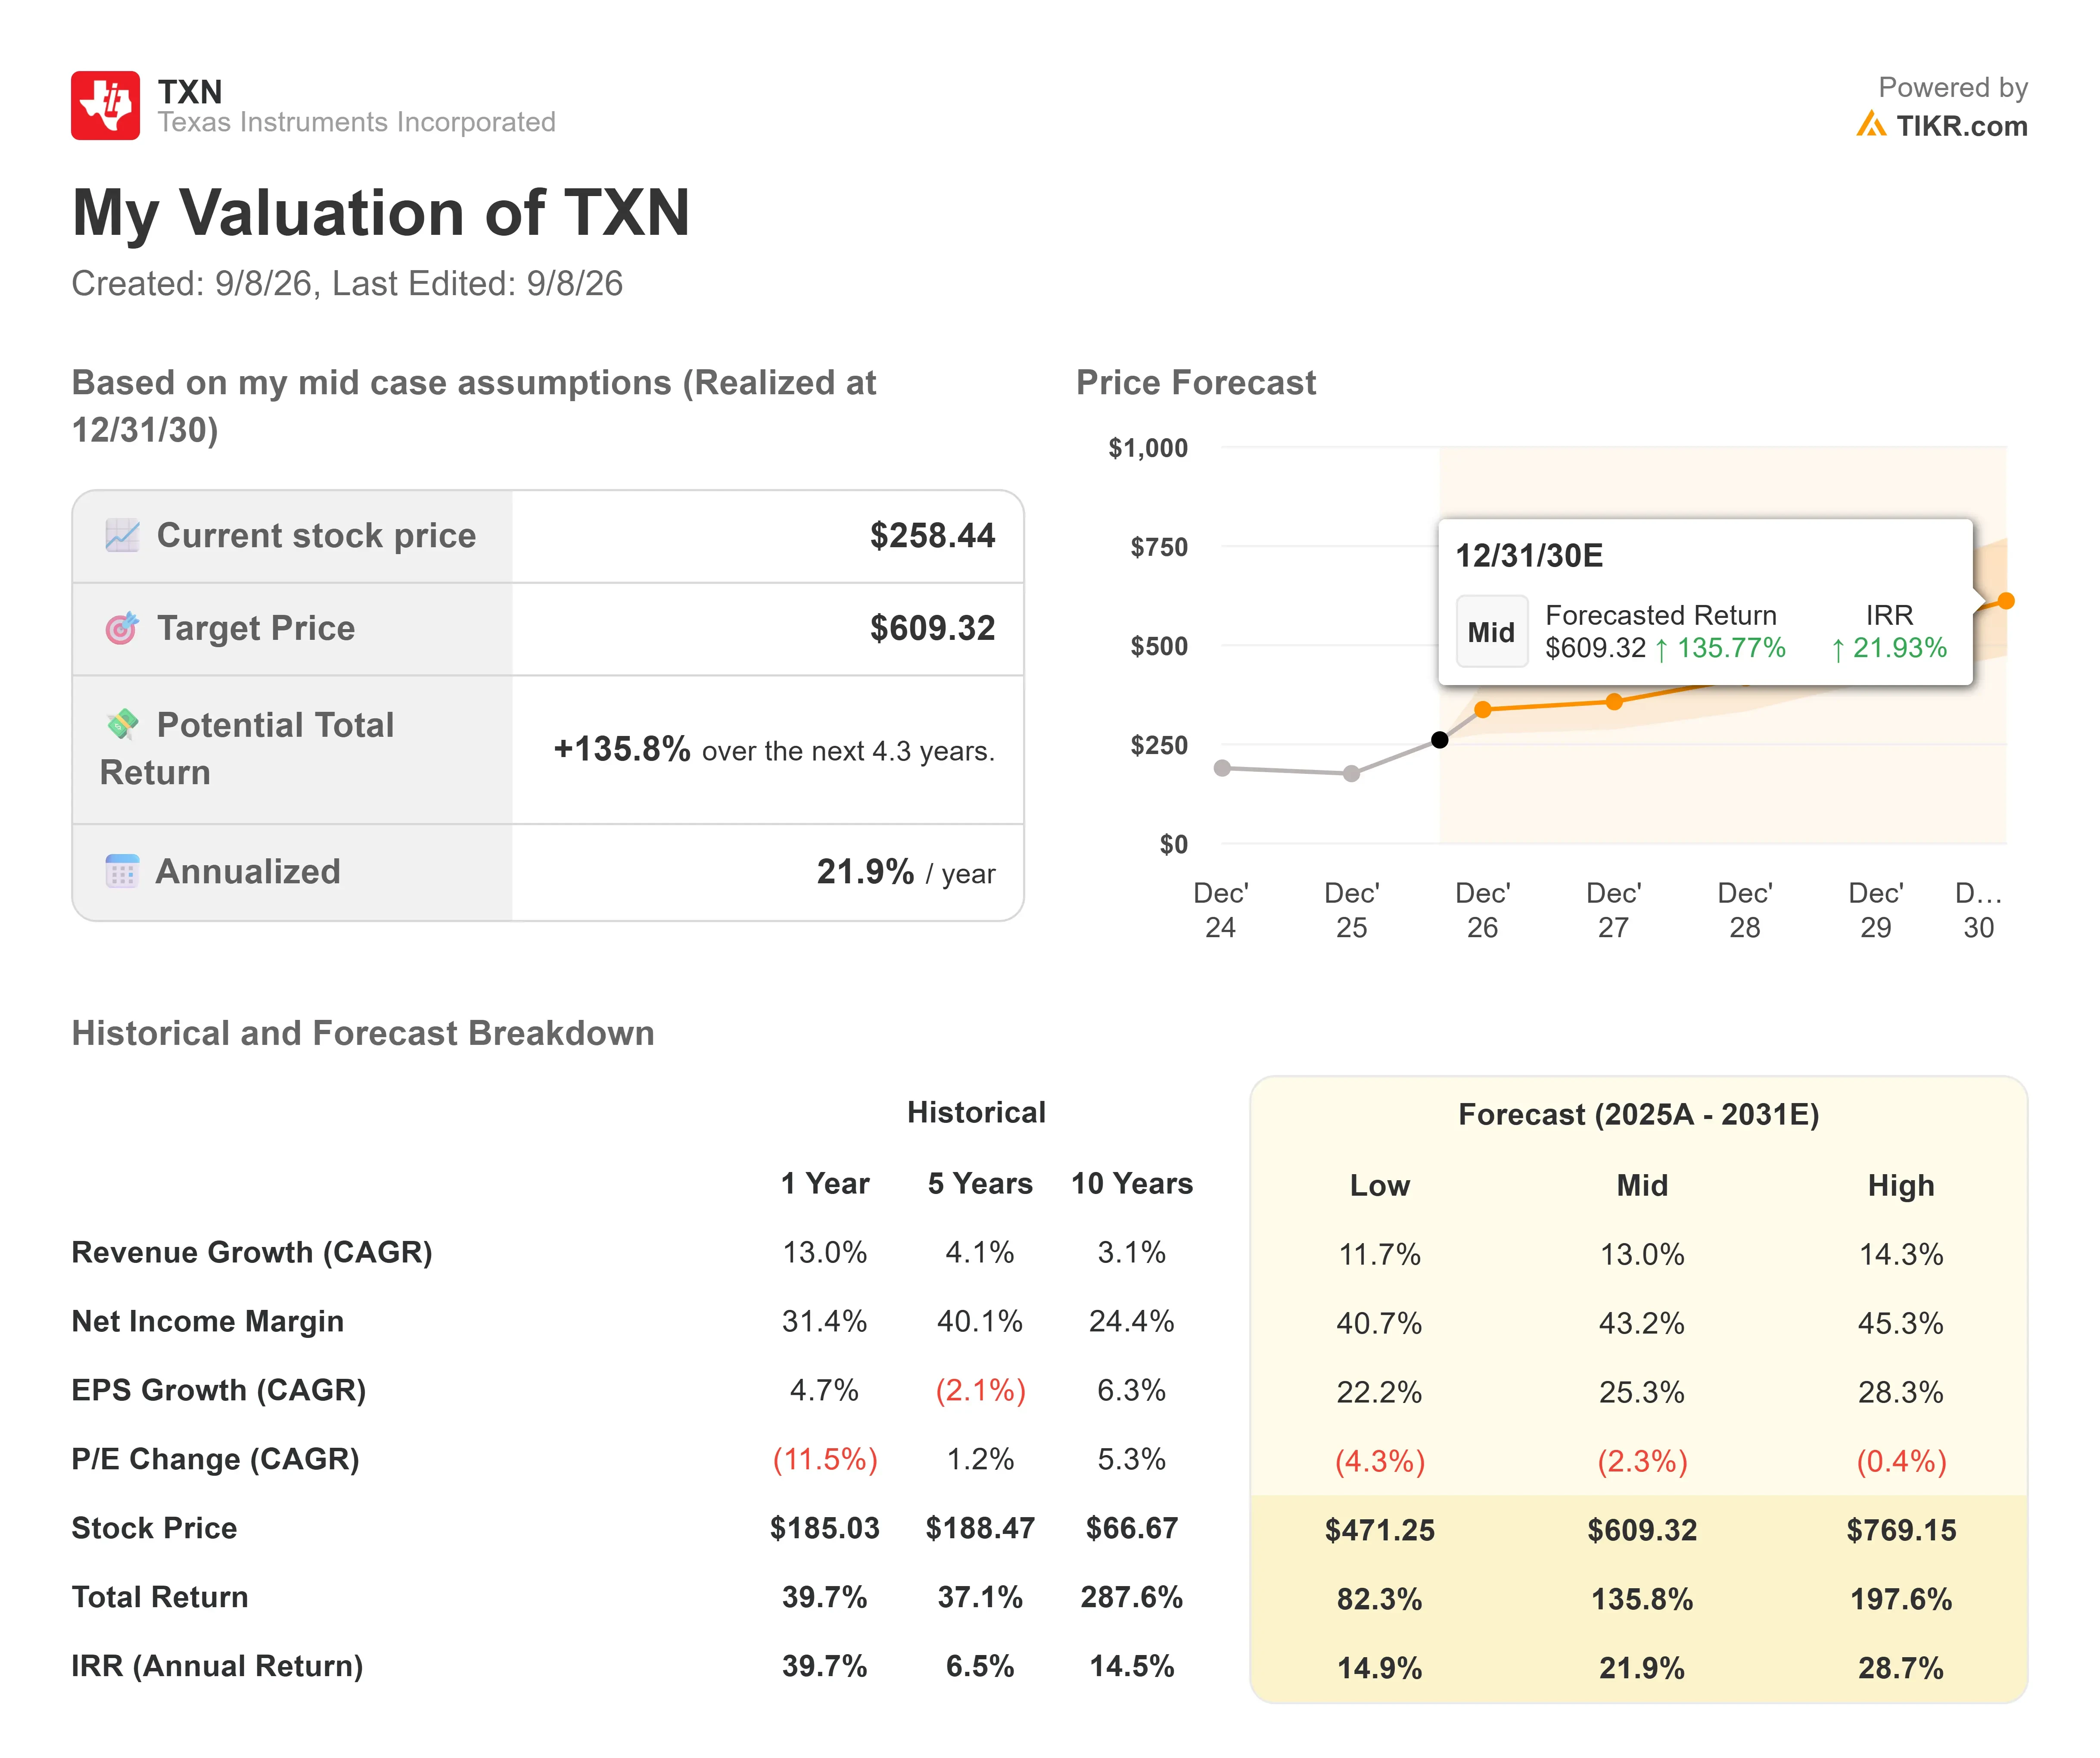
Semiconductor stocks move with industry cycles, and TI is no exception. Here’s how TXN stock might perform under different scenarios through December 2030:
- Low Case: If revenue growth settles at 11.7% and net income margins come in at 40.7%, investors could still see an 82.3% total return, or about 14.9% annually.
- Mid Case: With 13.0% growth and 43.2% margins, we expect a total return of 135.8%, or roughly 21.9% annually.
- High Case: If the current upcycle runs hotter than expected, pushing revenue growth to 14.3% and margins to 45.3%, returns could reach 197.6% total, or about 28.7% annually.
See what analysts think about TXN stock right now (Free with TIKR) >>>
The spread between these outcomes largely depends on how long this broad-based recovery lasts across TI’s end markets, and how successfully the company converts its capacity advantage and pricing initiatives into sustained margin expansion.
How Much Upside Does Texas Instruments Stock Have From Here?
With TIKR’s new Valuation Model tool, you can estimate a stock’s potential share price in under a minute.
All it takes is three simple inputs:
- Revenue Growth
- Operating Margins
- Exit P/E Multiple
If you’re not sure what to enter, TIKR automatically fills in each input using analysts’ consensus estimates, giving you a quick, reliable starting point.
From there, TIKR calculates the potential share price and total returns under Bull, Base, and Bear scenarios so you can quickly see whether a stock looks undervalued or overvalued.
See a stock’s true value in under 60 seconds (Free with TIKR) >>>
Looking for New Opportunities?
- See what stocks billionaire investors are buying so you can follow the smart money.
- Analyze stocks in as little as 5 minutes with TIKR’s all-in-one, easy-to-use platform.
- The more rocks you overturn… the more opportunities you’ll uncover. Search 100K+ global stocks, global top investor holdings, and more with TIKR.
Disclaimer:
Please note that the articles on TIKR are not intended to serve as investment or financial advice from TIKR or our content team, nor are they recommendations to buy or sell any stocks. We create our content based on TIKR Terminal’s investment data and analysts’ estimates. Our analysis might not include recent company news or important updates. TIKR has no position in any stocks mentioned. Thank you for reading, and happy investing!