Key Takeaways:
- Cost Discipline Building: Norwegian identified another $100 million in annualized savings in Q2 2026, bringing total cost actions over two quarters to roughly $225 million.
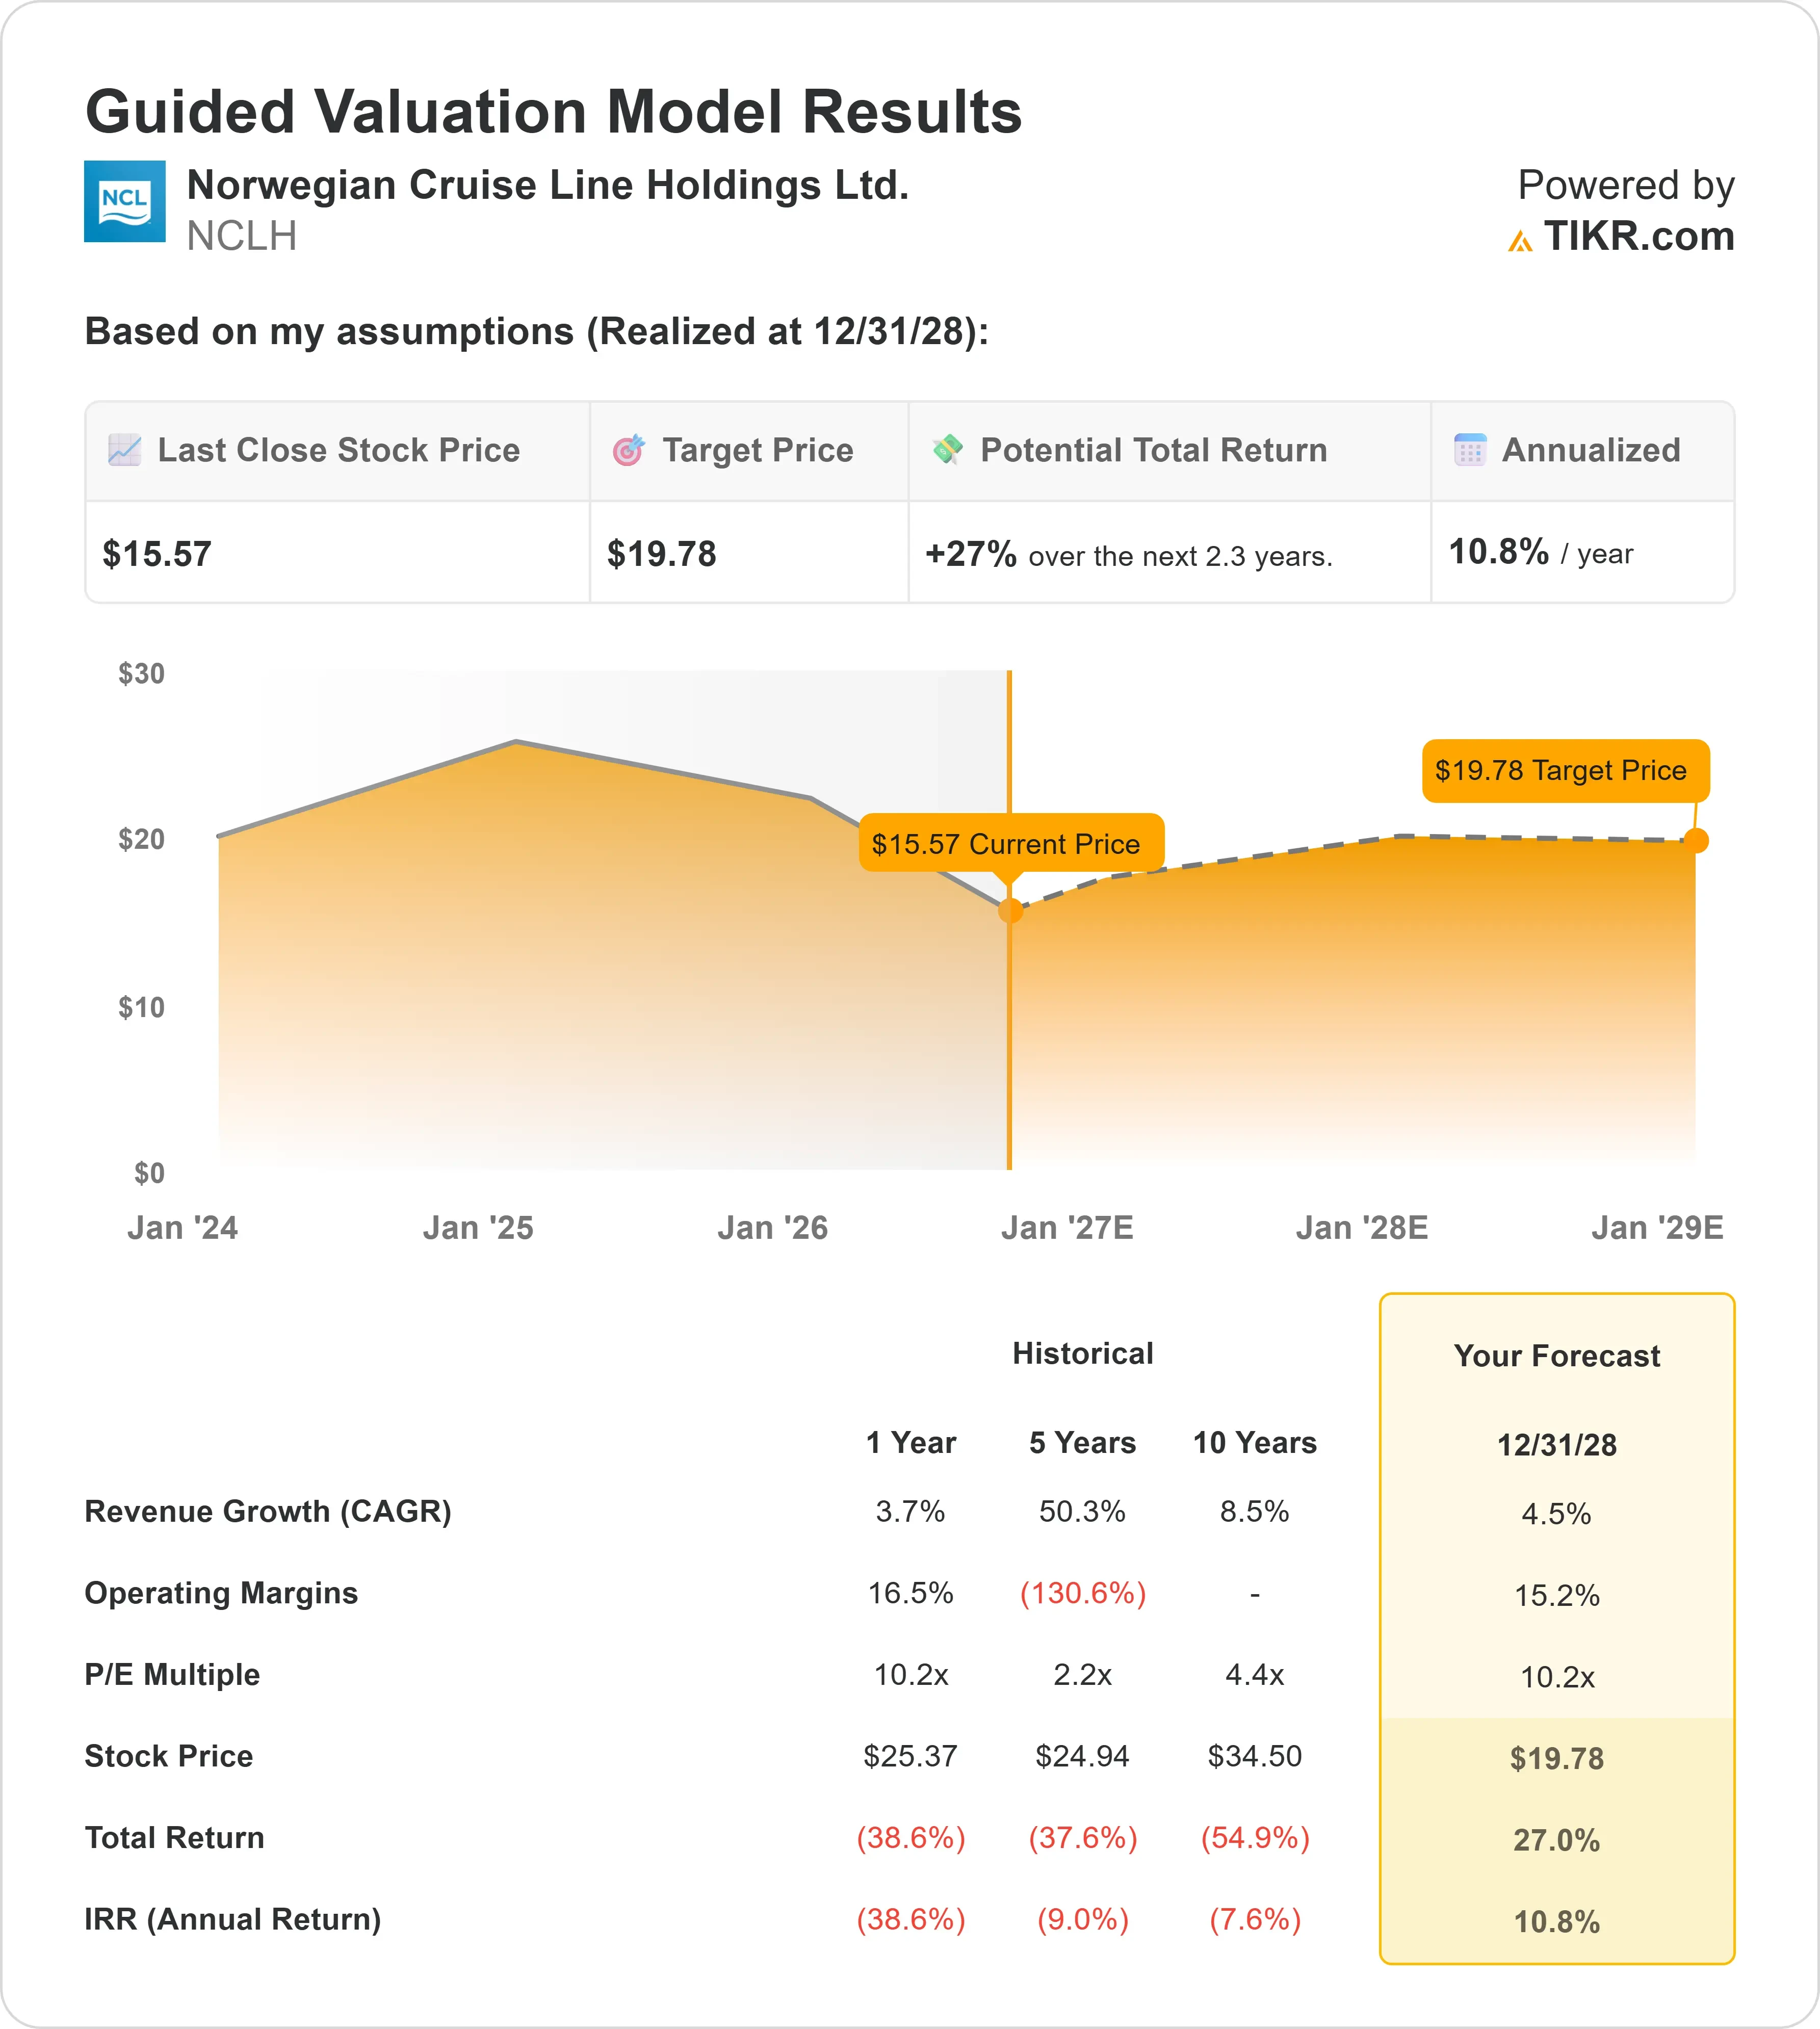
- Price Projection: Based on current execution, NCLH stock could reach $20 by December 2028.
- Potential Gains: This target implies a total return of 27% from the current price of $16.
- Annual Return: Investors could see roughly 11% annualized growth over the next 2.3 years.
Now Live: Discover how much upside your favorite stocks could have using TIKR’s new Valuation Model (It’s free)>>>
Norwegian Cruise Line Holdings (NCLH) posted Q2 2026 results that beat guidance even as the underlying business remains under pressure.
Revenue grew 5%, adjusted EBITDA of $666 million topped guidance by $34 million, and adjusted EPS of $0.48 beat estimates by $0.10.
CEO John Chidsey, five months into the job, said the company is in the middle of a turnaround focused on rebuilding demand at the core Norwegian brand.
Net yield fell 2.6% in the quarter, though that came in better than expected.
The company lowered full-year net yield guidance to a decline of roughly 5%, and Q3 yields are expected to fall 8.9%, reflecting a booked position that remains below management’s target.
Much of the pressure is concentrated in European sailings, where North American travelers have pulled back amid elevated airfare and macro uncertainty.
NCLH trades around $16 today, down sharply from a year ago, as investors wait to see whether new leadership, marketing changes, and cost cuts can turn things around.
See analysts’ full growth forecasts and estimates for NCLH stock (It’s free) >>>
What the Model Says for Norwegian Cruise Line Stock
Norwegian operates three cruise brands: the contemporary Norwegian Cruise Line and the luxury Oceania and Regent brands.
Management says the turnaround problem is almost entirely self-inflicted, tied to how the Norwegian brand has been marketed and priced, not the underlying product.
The company is shifting toward “baseloading,” a more competitive pricing approach earlier in the booking curve rather than holding prices high and discounting closer to sailing dates.
It’s also rolling out interim marketing focused on premium families, and opening the Great Tides Waterpark at Great Stirrup Cay in September, a nearly 6-acre attraction management believes will meaningfully boost the island’s revenue potential.
On the luxury side, Oceania and Regent are performing well. Management is reshaping Oceania’s fleet toward smaller, more intimate ships and selling the Oceania Sirena, while Regent is introducing larger entry-level suites to strengthen its ultra-luxury positioning.
Using a forecast of 4.5% annual revenue growth and 15.2% operating margins, our model projects the stock could reach $20 within 2.3 years. This assumes a 10.2x price-to-earnings multiple, in line with NCLH’s own one-year average.
Our Valuation Assumptions
Estimate a company’s fair value instantly (Free with TIKR) >>>
Our Valuation Assumptions
TIKR’s Valuation Model lets you plug in your own assumptions for a company’s revenue growth, operating margins, and P/E multiple, and calculates the stock’s expected returns.
Here’s what we used for Norwegian Cruise Line stock:
1. Revenue Growth: 4.5%
NCLH grew revenue 3.7% in 2025, a sharp slowdown from the 50.3% average over the past five years, which was skewed by the post-pandemic recovery.
Capacity growth is moderating too, from 7% in 2026 to a 2.5% CAGR through 2029 as new ship deliveries slow.
We’re assuming growth settles near 4.5% as turnaround efforts on pricing and marketing gradually take hold.
2. Operating margins: 15.2%
Operating margin for 2025 stood at 15.9%, above the three-year average of around 14%.
Cost discipline has been a bright spot, with unit costs excluding fuel growing 1% or less for three consecutive years. We assume margins will hold near current levels as further savings offset near-term revenue pressure from the turnaround.
3. Exit P/E Multiple: 10.2x
NCLH currently trades at 12.2x forward earnings, above its one-year average of 10.2x.
We’re assuming the multiple settles back toward that one-year average, reflecting ongoing uncertainty about how quickly the Norwegian brand’s demand issues resolve, balanced against strong performance at Oceania and Regent.
Build your own Valuation Model to value any stock (It’s free!) >>>
What Happens If Things Go Better or Worse?
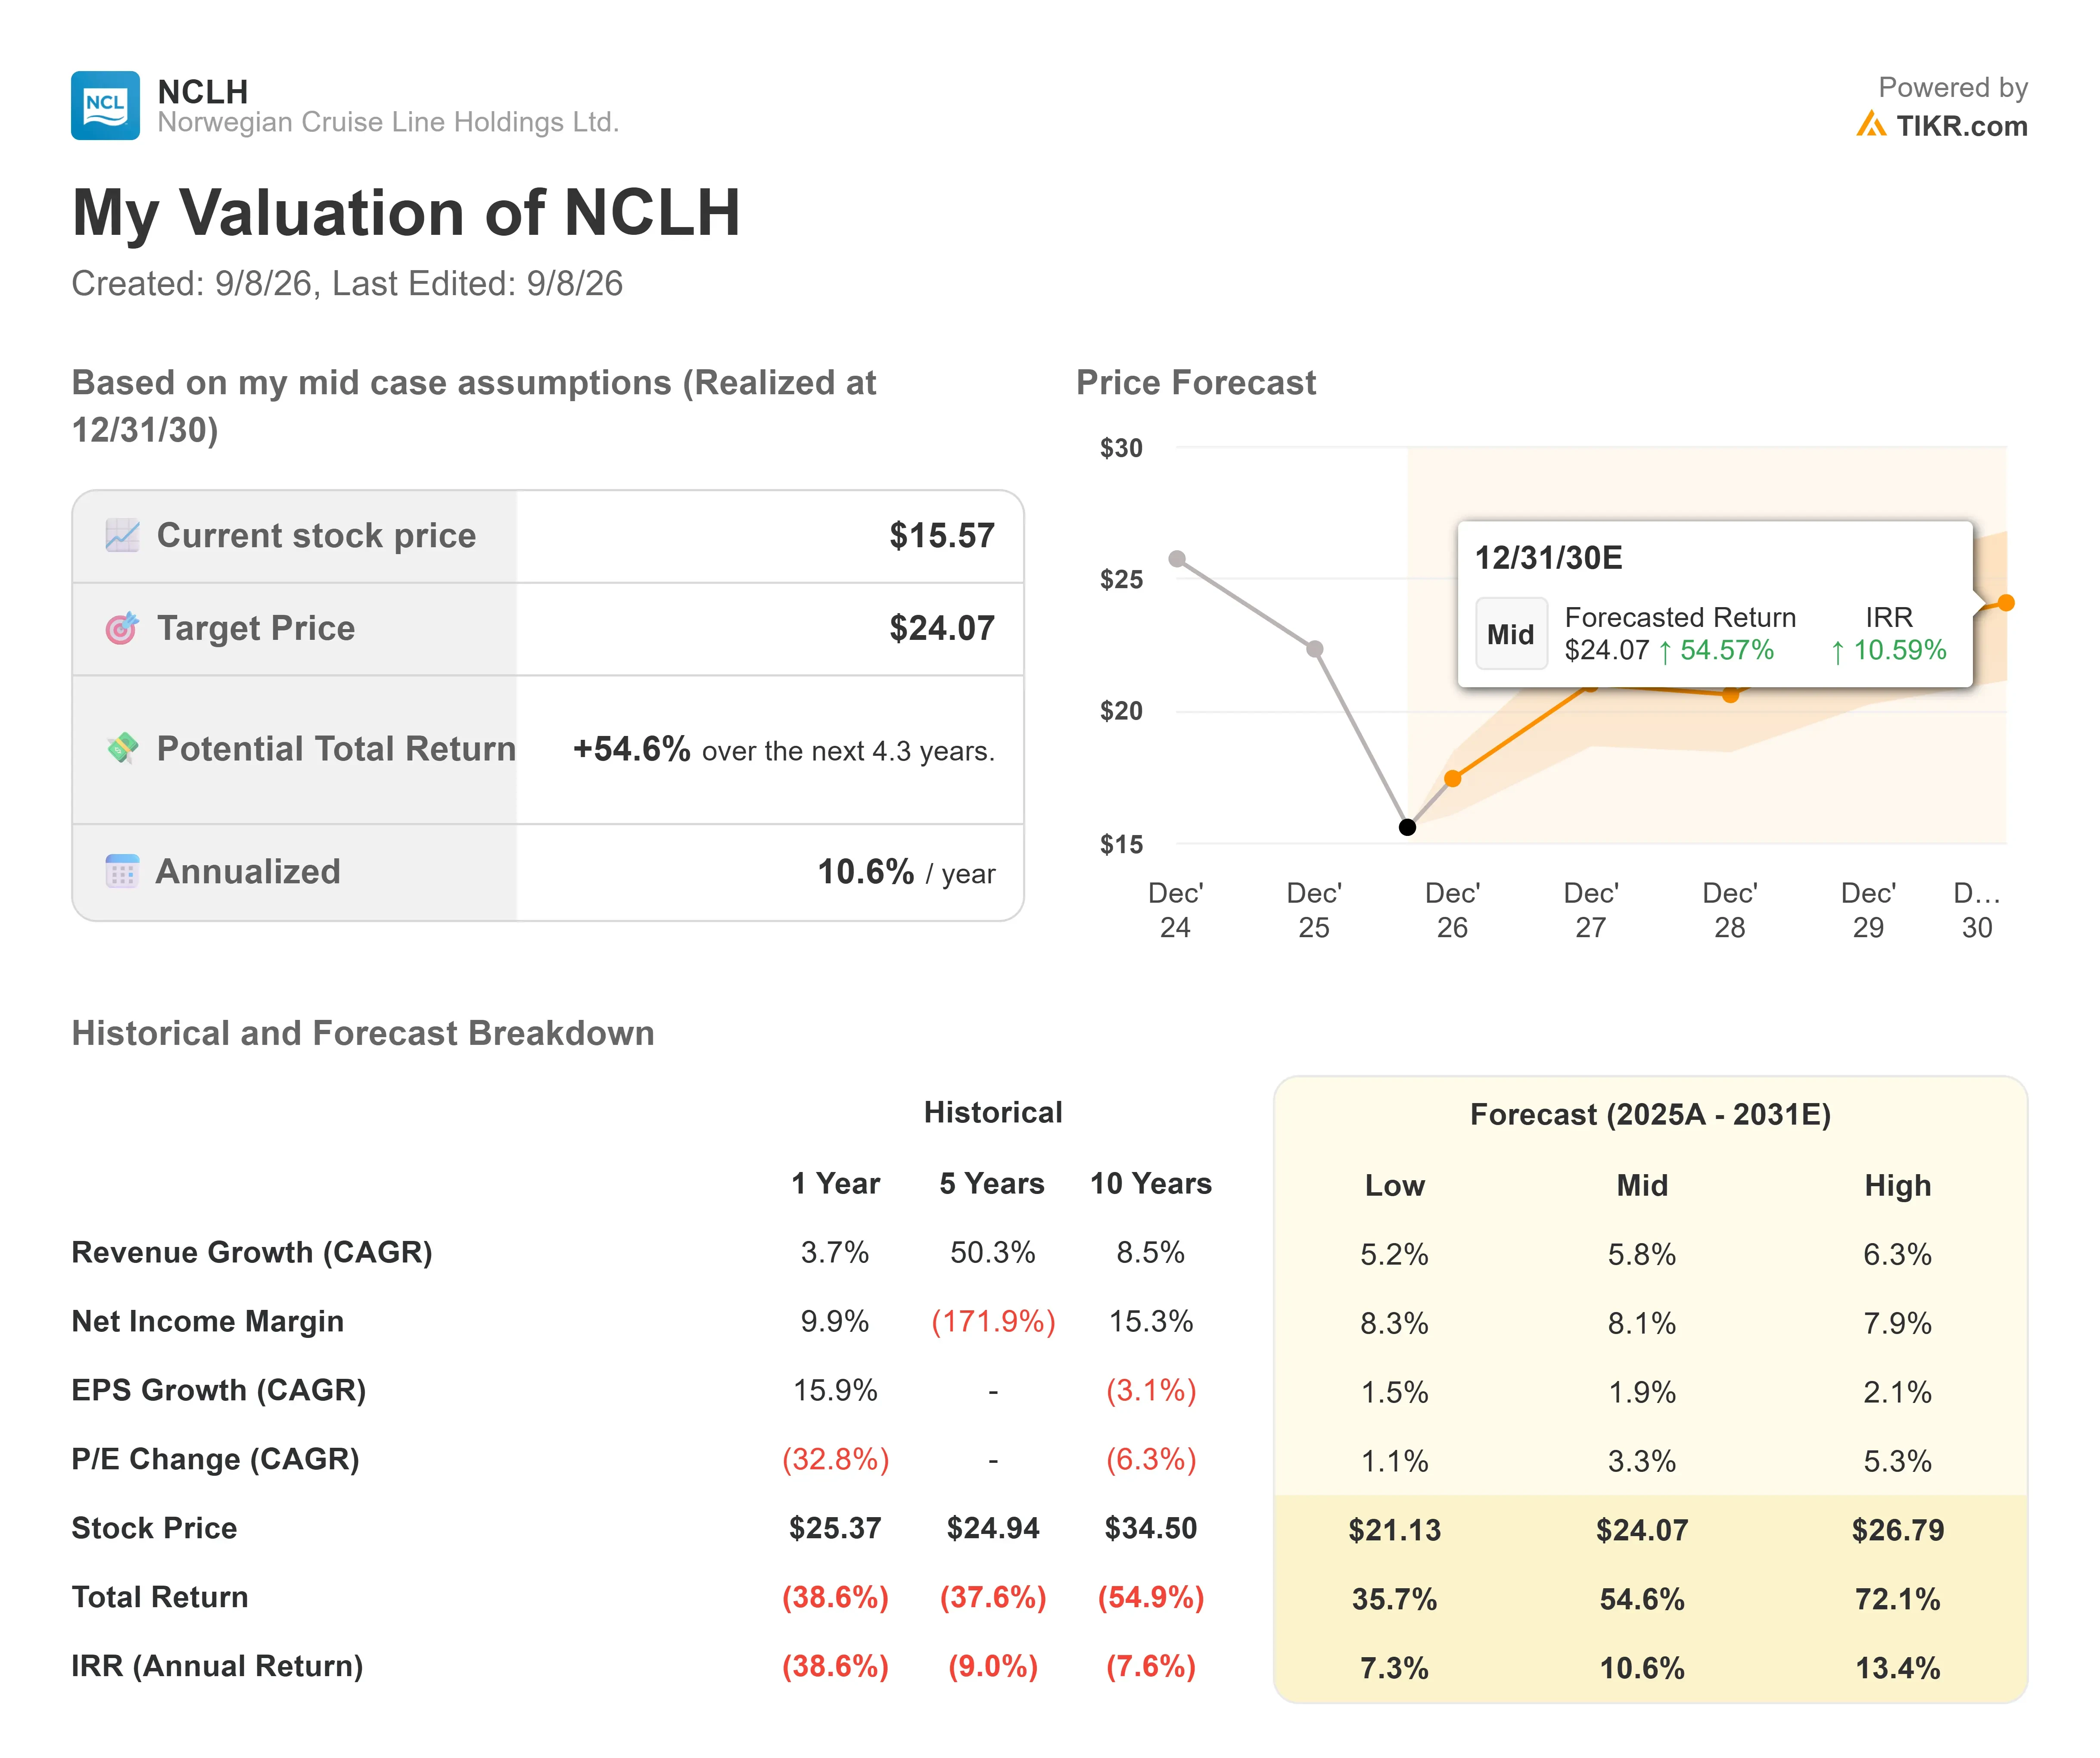
Cruise stocks are sensitive to consumer demand and execution risk, especially mid-turnaround. Here’s how NCLH stock might perform under different scenarios through December 2030:
- Low Case: If revenue growth settles at 5.2% and net income margins come in at 8.3%, investors could still see a 35.7% total return, or about 7.3% annually.
- Mid Case: With 5.8% growth and 8.1% margins, we expect a total return of 54.6%, or roughly 10.6% annually.
- High Case: If the marketing and pricing overhaul works faster than expected, pushing revenue growth to 6.3% and margins to 7.9%, returns could reach 72.1% total, or about 13.4% annually.
See what analysts think about NCLH stock right now (Free with TIKR) >>>
The spread between these outcomes largely depends on how quickly the new baseloading pricing strategy and marketing campaigns rebuild demand at the Norwegian brand, and whether European sailings recover as geopolitical uncertainty eases.
How Much Upside Does Norwegian Cruise Line Stock Have From Here?
With TIKR’s new Valuation Model tool, you can estimate a stock’s potential share price in under a minute.
All it takes is three simple inputs:
- Revenue Growth
- Operating Margins
- Exit P/E Multiple
If you’re not sure what to enter, TIKR automatically fills in each input using analysts’ consensus estimates, giving you a quick, reliable starting point.
From there, TIKR calculates the potential share price and total returns under Bull, Base, and Bear scenarios so you can quickly see whether a stock looks undervalued or overvalued.
See a stock’s true value in under 60 seconds (Free with TIKR) >>>
Looking for New Opportunities?
- See what stocks billionaire investors are buying so you can follow the smart money.
- Analyze stocks in as little as 5 minutes with TIKR’s all-in-one, easy-to-use platform.
- The more rocks you overturn… the more opportunities you’ll uncover. Search 100K+ global stocks, global top investor holdings, and more with TIKR.
Disclaimer:
Please note that the articles on TIKR are not intended to serve as investment or financial advice from TIKR or our content team, nor are they recommendations to buy or sell any stocks. We create our content based on TIKR Terminal’s investment data and analysts’ estimates. Our analysis might not include recent company news or important updates. TIKR has no position in any stocks mentioned. Thank you for reading, and happy investing!