Key Stats for ASML Stock
- Past-Week Performance: 2.56%
- 52-Week Range: €435 to €1,013
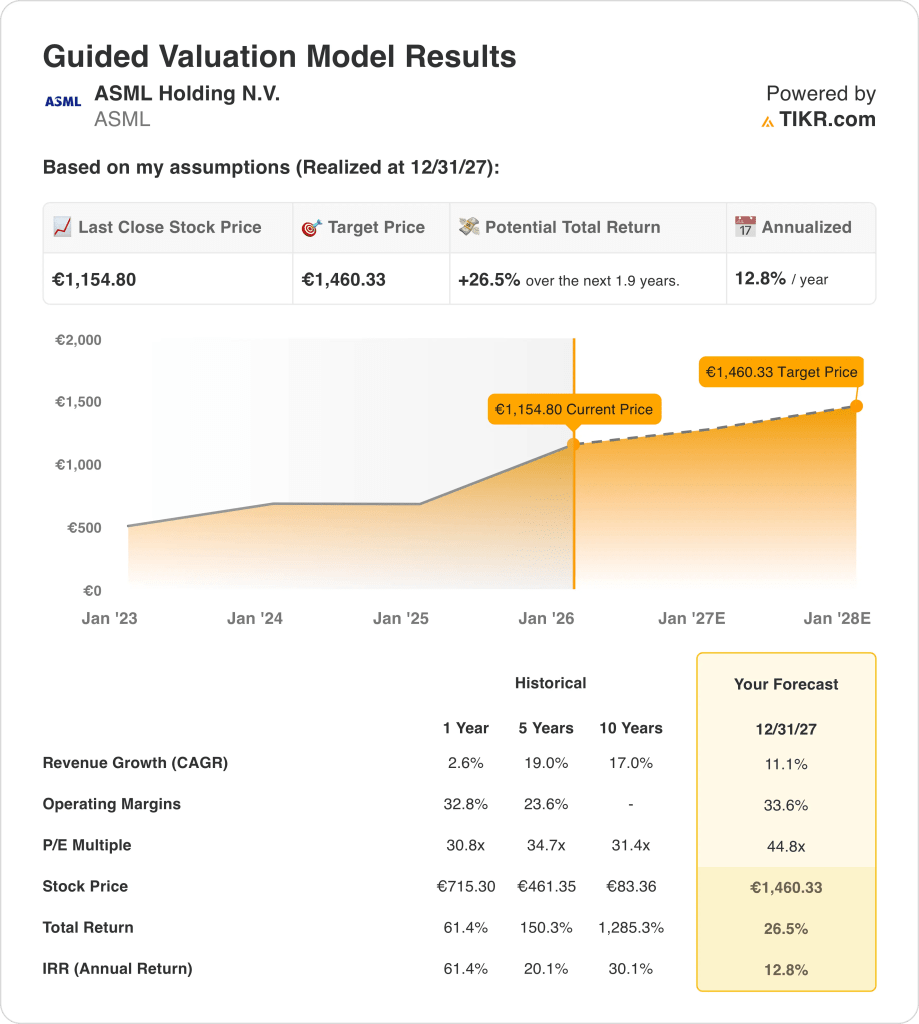
- Valuation Model Target Price: €1,460
- Implied Upside: 26.5% 1.9 over years
What Happened?
ASML Holding (ASML) stock rose about 5% during the third week of January, following macro-driven strength across semiconductor equipment names tied to U.S.–Taiwan trade developments.
The move was tied to reports that the U.S.–Taiwan trade deal could boost chip production, benefiting key suppliers such as ASML, Lam Research, and Applied Materials.
The development mattered because ASML’s valuation is sensitive to shifts in long-term semiconductor capital spending expectations and geopolitical trade alignment.
During the period, ASML reported no changes to guidance, order demand trends, margin expectations, or its long-term outlook.
The move reflects a recalibration of expectations rather than a deterioration in the underlying business, driven by new trade-related information.
Is ASML Stock Fairly Valued Right Now?
Under the valuation model shown, the stock is modeled using:
- Revenue Growth: 11.1%
- Operating Margins: 33.6%
- Exit P/E Multiple: 44.8x
The valuation model assesses ASML through fiscal 2027, dependent on revenue growth, margin expansion, and exit multiple assumptions.
The model assumes 11.1% revenue CAGR, 33.6% operating margins, and a 44.8x exit P/E multiple.
Based on these inputs, the model estimates a €1,460 target price, implying 26.5% total upside and 12.8% annualized returns.
Execution depends on sustained EUV demand, foundry capital spending, pricing discipline, and backlog conversion supporting revenue growth and margins.
The current valuation reflects execution risk and cycle sensitivity, meaning ASML stock may remain volatile if semiconductor investment assumptions fail to materialize.
Value Any Stock in Under 60 Seconds (It’s Free)
With TIKR’s new Valuation Model tool, you can estimate a stock’s potential share price in under a minute.
All it takes is three simple inputs:
- Revenue Growth
- Operating Margins
- Exit P/E Multiple
From there, TIKR calculates the potential share price and total returns under Bull, Base, and Bear scenarios so you can quickly see whether a stock looks undervalued or overvalued.
If you’re not sure what to enter, TIKR automatically fills in each input using analysts’ consensus estimates, giving you a quick, reliable starting point.