Key Takeaways:
- Revenue Base: Verizon Communications Inc. generated about $137 billion LTM revenue, which supports stable cash flow in a mature US telecom market.
- Margin Profile: Verizon maintains operating margins near 23%, reflecting network scale and cost discipline despite revenue growth around 2%.
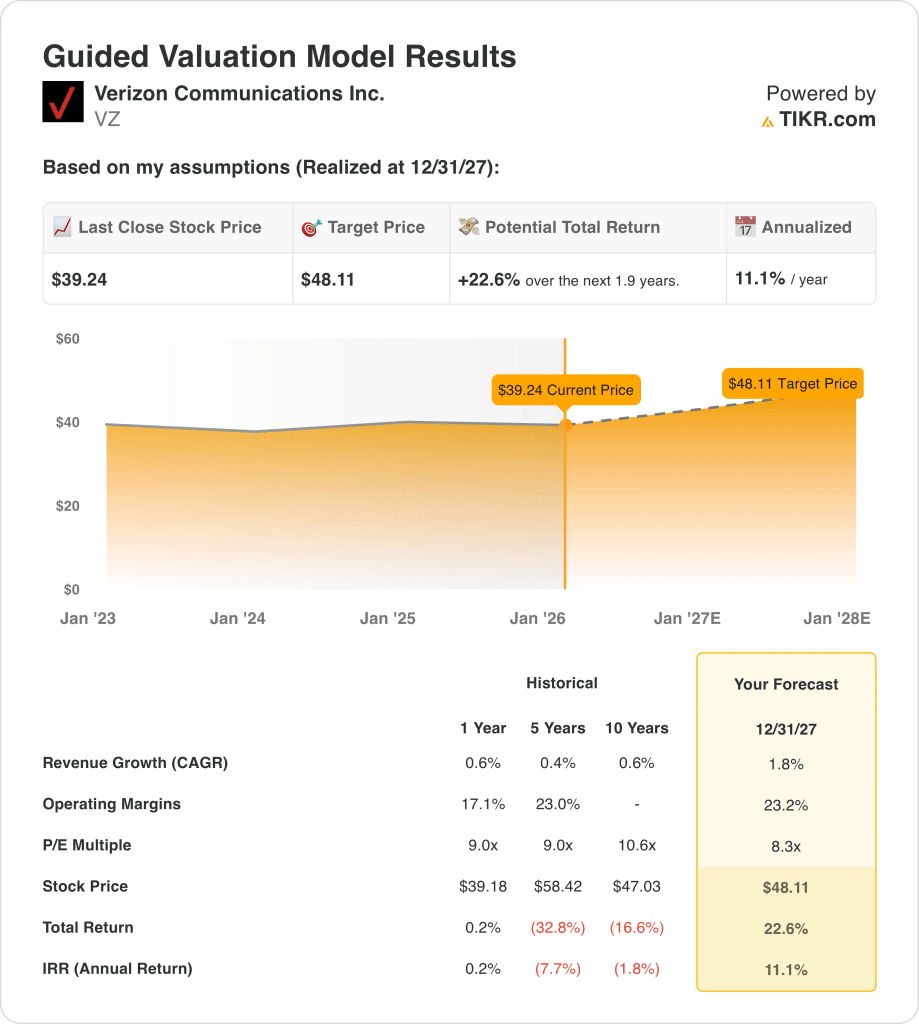
- Price Projection: Based on modest growth and steady margins, Verizon stock could reach $48 by 2027 from a current price near $39.
- Return Outlook: This implies about 23% total upside and roughly 11% annualized returns over the next 2 years.
Verizon Communications (VZ) provides wireless and broadband services and generated about $137 billion revenue over the last twelve months which supports stable cash flows.
Verizon completed the Frontier acquisition at $39 per share which expands fiber assets and strengthens its US broadband position.
In Q3 2025, Verizon reported $34 billion revenue and about $5 billion net income which shows resilient operating performance.
Operating margins near 23% and a $164 billion market cap frame Verizon as a cash generative but slow growth telecom.
Verizon trades near $39 as steady cash flows face slow growth, leverage concerns, and heavy network investment needs.
What the Model Says for VZ Stock
We evaluated Verizon Stock using stable operating income, strong free cash flow, and dividend coverage that define capital returns in a mature telecom position.
Using 2% revenue growth, 23% margins, and a 10x exit P/E, the model points to durable earnings.
The $48 target implies 23% total upside and about 11% annualized returns over two years.
Our Valuation Assumptions
TIKR’s Valuation Model lets you plug in your own assumptions for a company’s revenue growth, operating margins, and P/E multiple, and calculates the stock’s expected returns.
Here’s what we used for VZ stock:
1. Revenue Growth: 1.8%
Verizon stock revenue reached about $137 billion LTM, reflecting a mature wireless market with limited subscriber growth and stable pricing dynamics.
Recent quarterly revenue of $34 billion shows modest expansion, supported by fixed wireless access adoption and gradual broadband share gains.
Growth remains constrained by saturation in core wireless services and intense competition, while fiber expansion adds incremental but measured revenue contribution.
A 1.8% revenue growth assumption reflects a mature wireless business with steady demand that underpins projected 11% annualized returns.
2. Operating Margins: 23.2%
Verizon historically sustained operating margins between 22% and 27%, reflecting network scale benefits and predictable cost structures.
Recent margins near 23% align with disciplined capital spending and workforce reductions exceeding 13,000 positions by late 2025.
Margin upside depends on lower outsourced labor costs and steady wireless pricing, offset by ongoing network investment requirements.
In line with analyst consensus projections, 23.2% operating margins represent normalized efficiency consistent with Verizon’s mature telecom profile.
3. Exit P/E Multiple: 8.3x
Verizon has historically traded between roughly 9x and 11x earnings, reflecting stable cash flows but limited long term growth expectations.
The current valuation embeds caution tied to leverage levels, slow revenue expansion, and capital intensity across wireless and fiber networks.
Multiple expansion requires sustained free cash flow growth and balance sheet improvement rather than acceleration in top line growth.
Based on street consensus estimates, an 8.3x exit multiple reflects cautious sentiment while still supporting a $48 target and 11% annualized returns.
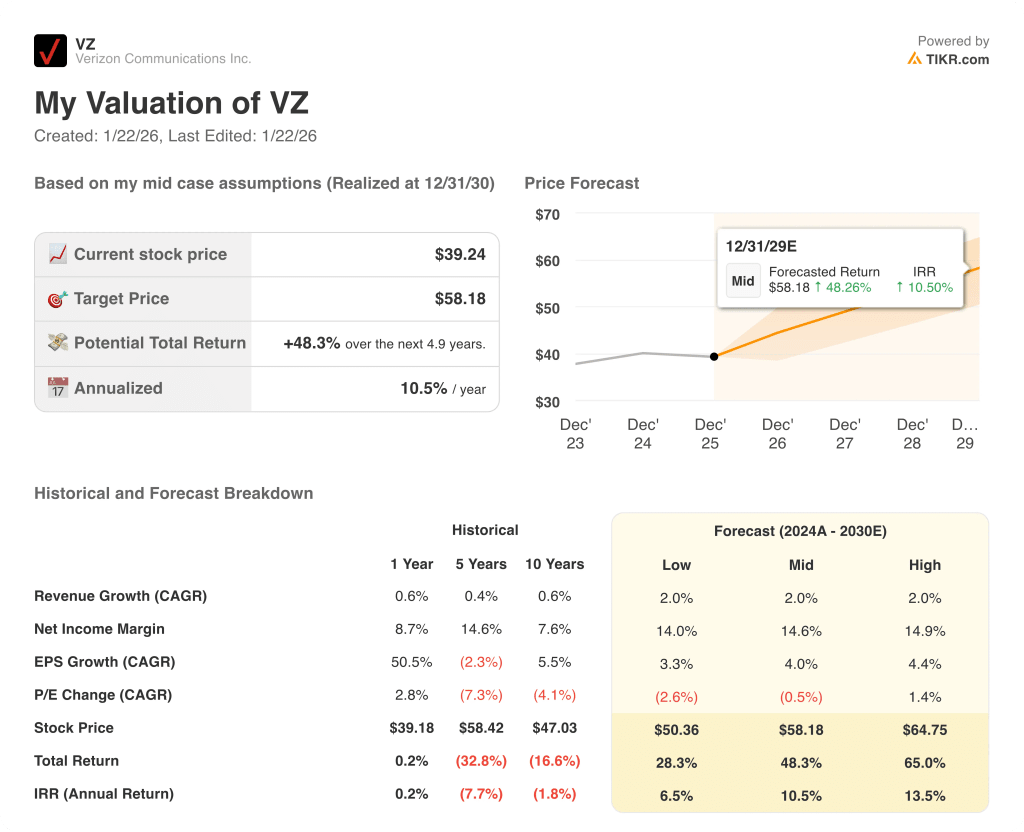
What Happens If Things Go Better or Worse?
Verizon stock outcomes depend on wireless demand stability, pricing discipline, and cost control, creating a range of execution paths through 2030.
- Low Case: If wireless pricing weakens and cost pressure persists, revenue grows around 2.0% and net margins hold near 14.0% → 6.5% annualized return.
- Mid Case: With core wireless execution holding steady, revenue growth near 2.0% and margins around 14.6% → 10.5% annualized return.
- High Case: If fiber and fixed wireless scale efficiently, revenue reaches about 2.0% and margins approach 14.9% → 13.5% annualized return.
Pricing discipline, network efficiency, and capital allocation support the $58 target price without requiring multiple expansion or speculative re-rating.
How Much Upside Does It Have From Here?
With TIKR’s new Valuation Model tool, you can estimate a stock’s potential share price in under a minute.
All it takes is three simple inputs:
- Revenue Growth
- Operating Margins
- Exit P/E multiple
If you’re not sure what to enter, TIKR automatically fills in each input using analysts’ consensus estimates, giving you a quick, reliable starting point.
From there, TIKR calculates the potential share price and total returns under Bull, Base, and Bear scenarios so you can quickly see whether a stock looks undervalued or overvalued.
Build your own assumptions around Verizon’s wireless and fiber outlook and see how they shape valuation outcomes on TIKR for free →Here’s why Verizon Communications Inc. stock could deliver about 48% total returns and roughly 11% annualized gains by 2030 under conservative growth assumptions.
Looking for New Opportunities?
- See what stocks billionaire investors are buying so you can follow the smart money.
- Analyze stocks in as little as 5 minutes with TIKR’s all-in-one, easy-to-use platform.
- The more rocks you overturn… the more opportunities you’ll uncover. Search 100K+ global stocks, global top investor holdings, and more with TIKR.
Disclaimer:
Please note that the articles on TIKR are not intended to serve as investment or financial advice from TIKR or our content team, nor are they recommendations to buy or sell any stocks. We create our content based on TIKR Terminal’s investment data and analysts’ estimates. Our analysis might not include recent company news or important updates. TIKR has no position in any stocks mentioned. Thank you for reading, and happy investing!