Key Takeaways:
- Valuation Anchor: CVS stock trades at $81 with a modeled fair value of $98 based on normalized earnings and steady healthcare demand.
- Price Projection: CVS Health Corporation stock could reach $98 by 2027 using 5% revenue growth and a 10x earnings multiple.
- Potential Gains: This implies 20% total upside from the current price of $81 as margins stabilize and cash flow improves.
- Annual Return: The model points to about 10% annualized returns over the next 2 years driven by earnings recovery.
CVS Health Corporation (CVS) operates insurance, pharmacy benefits, and retail pharmacy businesses that generated about $392 billion in LTM revenue across the United States.
The stock drew attention in January 2026 after U.S. lawmakers raised antitrust concerns, increasing regulatory risk without changing near-term operations.
CVS Health generated $10 billion in LTM operating income with operating margins near 3%, reflecting healthcare cost pressure and reimbursement constraints.
CVS carries a market value near $105 billion, with growth tied to insurance enrollment, pharmacy volumes, and deeper service integration.
While revenue and profits are stabilizing, CVS stock trades near $81, leaving open whether current valuation reflects execution risks or earnings recovery potential.
What the Model Says for CVS Health Stock
We evaluated CVS Health stock using assumptions tied to insurance scale, pharmacy integration, and margin recovery across its diversified platforms.
Based on 5.1% revenue growth, 3.9% operating margins, and a 10.4x exit multiple, the model projects CVS reaching $97.74.
That implies a 19.9% total return, or about 9.8% annualized returns over the next 1.9 years.

Our Valuation Assumptions
TIKR’s Valuation Model lets you plug in your own assumptions for a company’s revenue growth, operating margins, and P/E multiple, and calculates the stock’s expected returns.
Here’s what we used for CVS stock:
1. Revenue Growth: 5.1%
CVS stock delivered 4% revenue growth over one year and 8% over five years through insurance scale and pharmacy volume expansion.
Recent growth reflects stabilization after acquisition-driven volatility, with Health Care Benefits and pharmacy services contributing more predictable top-line performance.
Forward growth remains supported by Medicare Advantage enrollment and pharmacy utilization, while regulatory scrutiny and pricing pressure cap acceleration potential.
cMarket expectations point to 5.1% revenue growth, balancing stable healthcare demand with reimbursement pressure, supporting about 9.8% annualized returns.
2. Operating Margins: 3.9%
CVS Health stock margins averaged 5% historically but fell from higher medical costs, utilization pressure, and insurance mix shifts.
Margins face pressure from utilization and integration costs, partly offset by pharmacy scale and cost discipline across retail and PBM units.
Normalization depends on medical cost control and improved insurance pricing, while wage inflation and reimbursement caps limit near-term margin expansion.
Consensus forecasts place operating margins at 3.9%, reflecting conservative normalization aligned with recent profitability and sustaining roughly 9.8% annualized returns.
3. Exit P/E Multiple: 10.4x
CVS stock has historically traded near 10x to 11x earnings, reflecting mature growth, regulatory exposure, and capital-intensive healthcare operations.
Current valuation embeds caution around antitrust scrutiny, insurance margin volatility, and long-term reimbursement risk across government-sponsored programs.
Multiple stability depends on earnings consistency and medical cost control rather than growth acceleration or investor sentiment shifts.
Street pricing assumptions use a 10.4x exit multiple, reflecting normalized earnings and implying a $97.74 target with 19.9% total returns.
What Happens If Things Go Better or Worse?
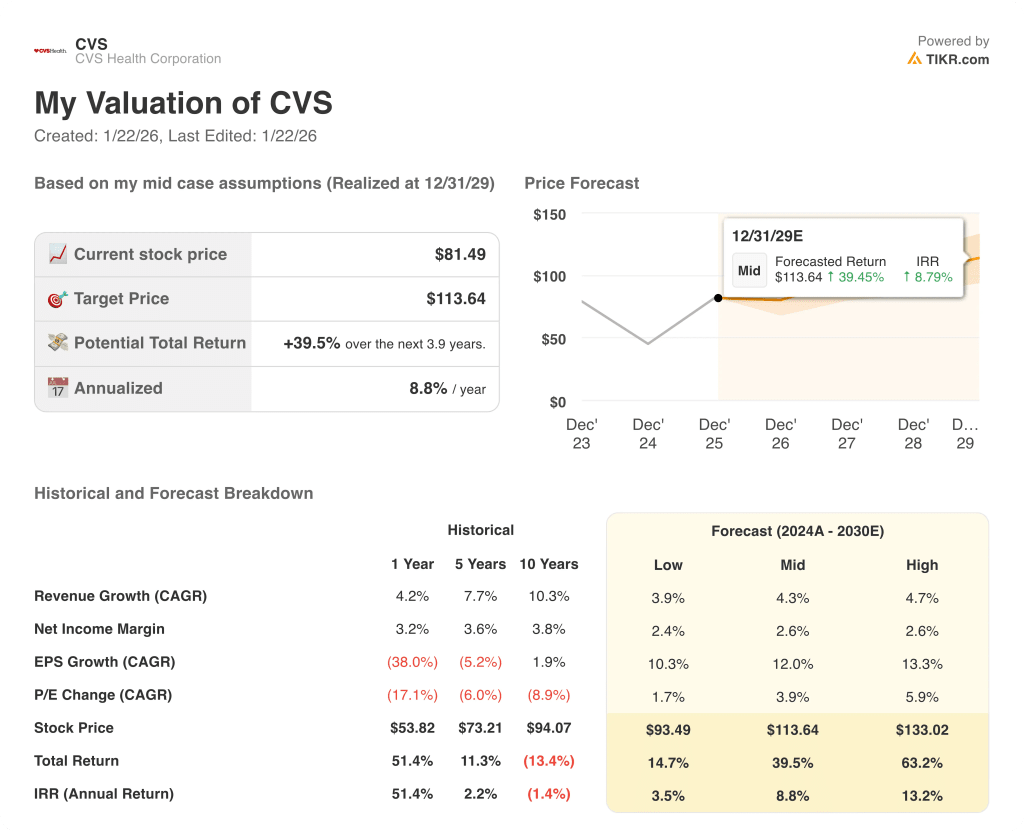
CVS stock’s outcomes depend on healthcare utilization trends, reimbursement discipline, and execution across insurance, pharmacy services, and retail operations through 2029.
- Low Case: With reimbursement pressure and muted benefit performance, revenue grows around 3.9% and margins hold near 2.4% → 3.5% annualized return.
- Mid Case: With core insurance stability and pharmacy services executing steadily, revenue growth near 4.3% and margins near 2.6% → 8.8% annualized return.
- High Case: If benefit margins recover and cost controls hold, revenue reaches about 4.7% and margins approach 2.6% → 13.2% annualized return.
The $113.64 mid-case target is achievable through steady execution across segments and earnings recovery, without relying on multiple expansion or market enthusiasm.
How Much Upside Does It Have From Here?
With TIKR’s new Valuation Model tool, you can estimate a stock’s potential share price in under a minute.
All it takes is three simple inputs:
- Revenue Growth
- Operating Margins
- Exit P/E multiple
If you’re not sure what to enter, TIKR automatically fills in each input using analysts’ consensus estimates, giving you a quick, reliable starting point.
From there, TIKR calculates the potential share price and total returns under Bull, Base, and Bear scenarios so you can quickly see whether a stock looks undervalued or overvalued.
Looking for New Opportunities?
- See what stocks billionaire investors are buying so you can follow the smart money.
- Analyze stocks in as little as 5 minutes with TIKR’s all-in-one, easy-to-use platform.
- The more rocks you overturn… the more opportunities you’ll uncover. Search 100K+ global stocks, global top investor holdings, and more with TIKR.
Disclaimer:
Please note that the articles on TIKR are not intended to serve as investment or financial advice from TIKR or our content team, nor are they recommendations to buy or sell any stocks. We create our content based on TIKR Terminal’s investment data and analysts’ estimates. Our analysis might not include recent company news or important updates. TIKR has no position in any stocks mentioned. Thank you for reading, and happy investing!