Key Stats for Amazon Stock
- Past-Week Performance: -3.26%
- 52-Week Range: $161 to $259
- Valuation Model Target Price: $
- Implied Upside: 35.3% over 1.9 years
What Happened?
Amazon.com, Inc. (AMZN) fell 3.3% during the third week of January, reflecting a broader pullback in large-cap technology stocks.
The move did not follow a company-specific earnings release, guidance update, or analyst action based on the available information.
The decline reflected Amazon stock’s valuation sensitivity following a strong prior run, prompting a short-term expectations reset.
Importantly, Amazon stock reflected no changes to company guidance, demand trends, margin trajectory, or long-term operating outlook.
The pullback appears driven by sentiment and valuation sensitivity, not operational performance, reflecting a short-term recalibration rather than new fundamental information.
Is Amazon Stock Fairly Valued Right Now?
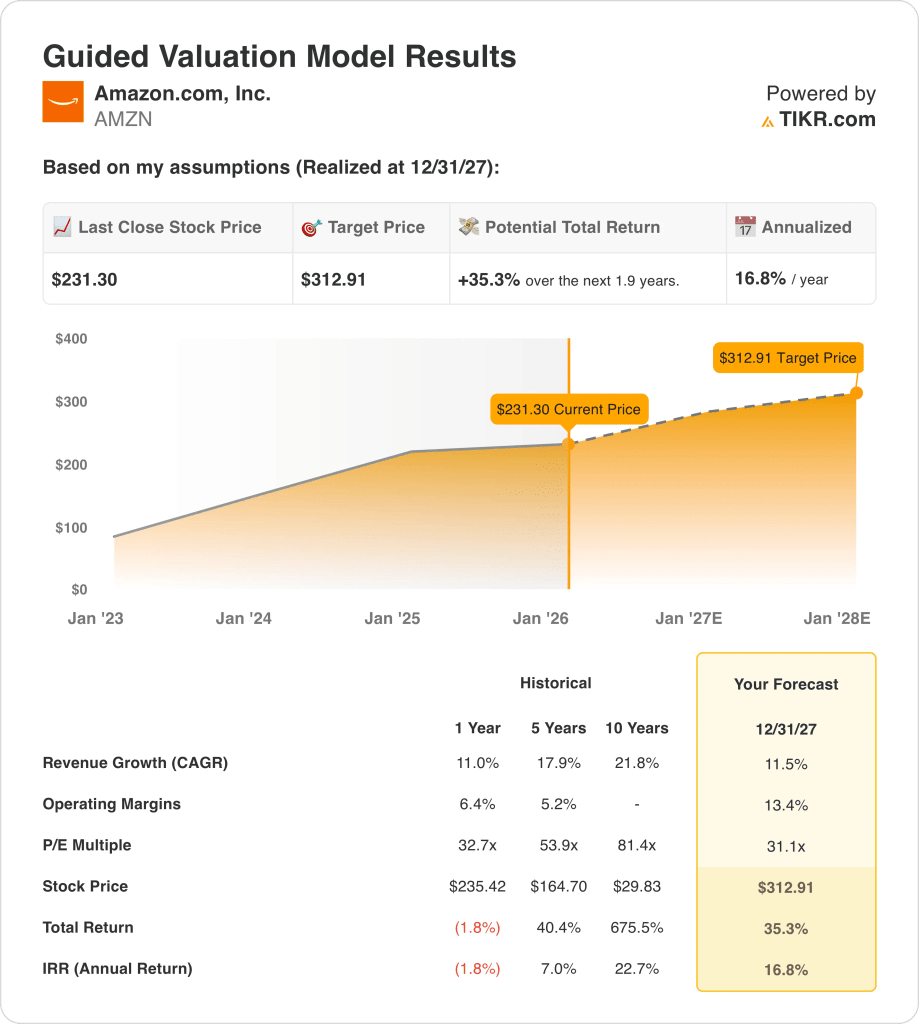
Under the valuation model shown, the stock is modeled using:
- Revenue Growth: 11.5%
- Operating Margins: 13.4%
- Exit P/E Multiple: 31.1x
The valuation model evaluates Amazon through fiscal 2027, with outcomes dependent on assumed revenue growth, margin expansion, and exit multiple realization.
The model assumes 11.5% revenue CAGR, 13.4% operating margins, and a 31.1x exit P/E multiple.
Based on these inputs, the model estimates a $312.91 target price, implying 35.3% total upside and 16.8% annualized returns.
Execution depends on AWS scale benefits, retail efficiency gains, advertising growth, pricing discipline, and fulfillment leverage supporting revenue growth and margins.
The current valuation reflects execution risk and earnings sensitivity, leaving Amazon stock susceptible to volatility if operating assumptions fail to materialize.
Value Any Stock in Under 60 Seconds (It’s Free)
With TIKR’s new Valuation Model tool, you can estimate a stock’s potential share price in under a minute.
All it takes is three simple inputs:
- Revenue Growth
- Operating Margins
- Exit P/E Multiple
From there, TIKR calculates the potential share price and total returns under Bull, Base, and Bear scenarios so you can quickly see whether a stock looks undervalued or overvalued.
If you’re not sure what to enter, TIKR automatically fills in each input using analysts’ consensus estimates, giving you a quick, reliable starting point.