
Key Stats for Amazon Stock
- Past-Month Performance: -18%
- 52-Week Range: $161 to $259
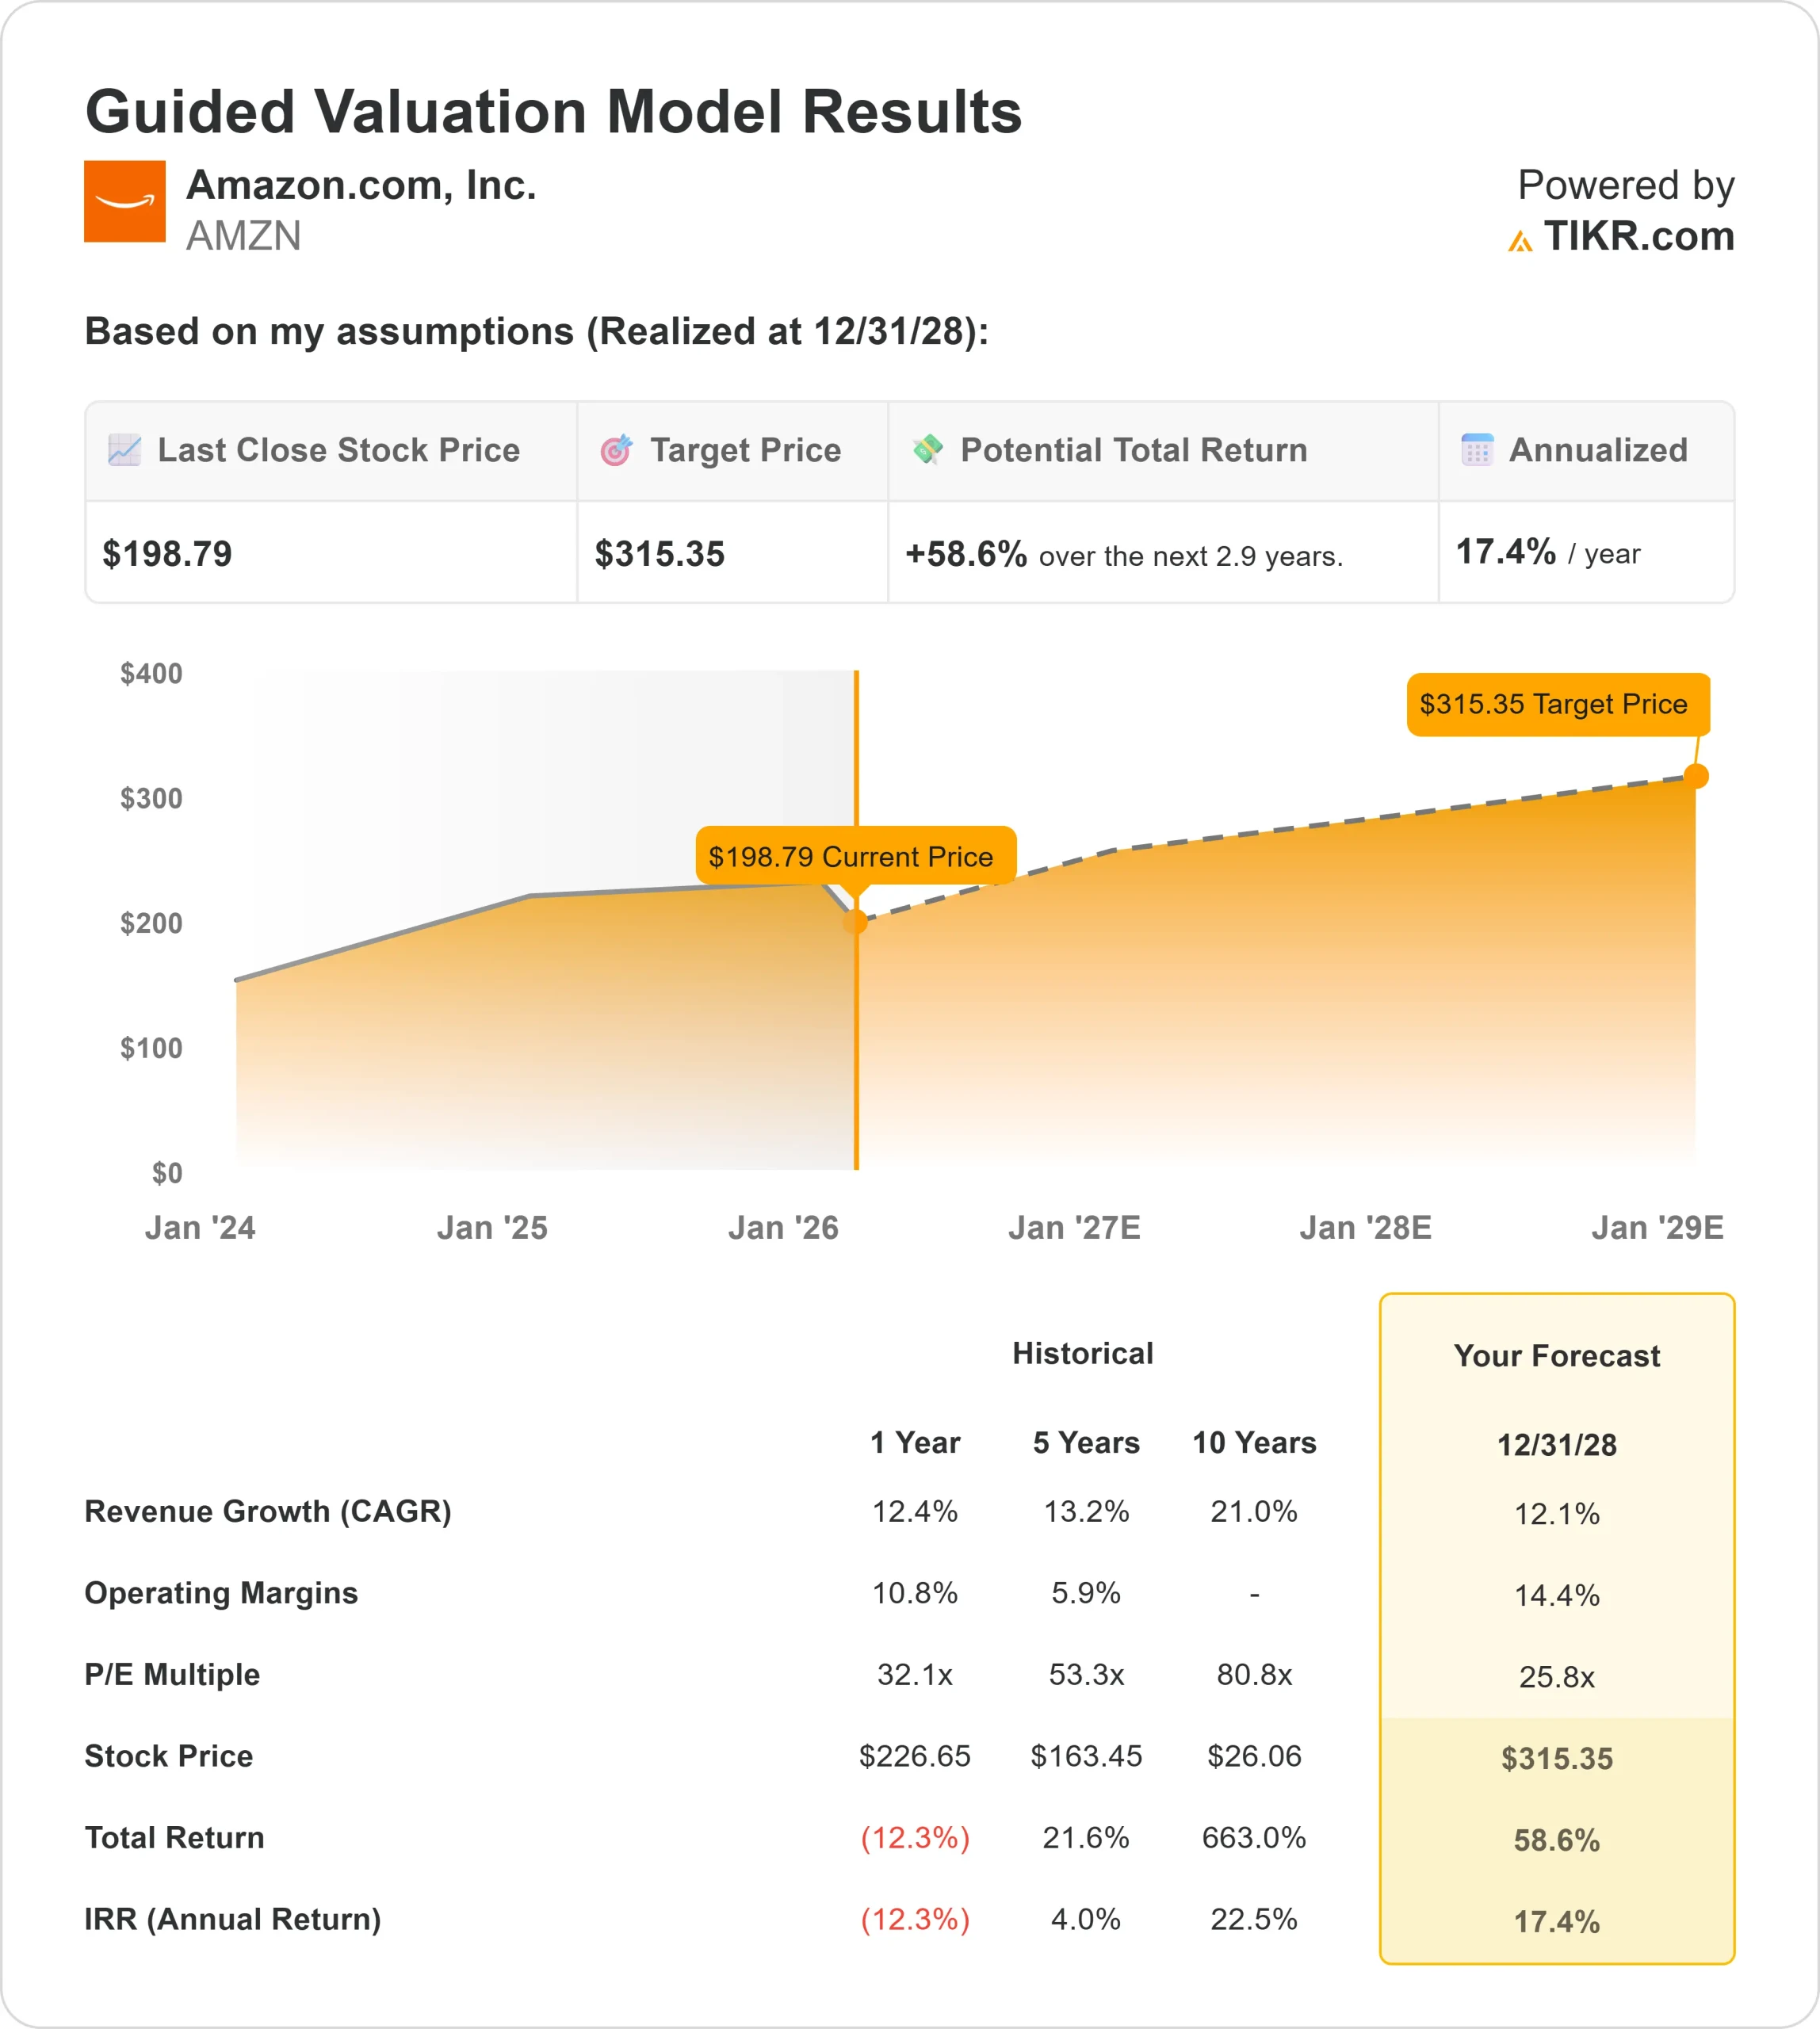
- Valuation Model Target Price: $315
- Implied Upside: 58.6%
Value your favorite stocks like Amazon with 5 years of analysts’ forecasts using TIKR’s new Valuation Model (It’s free) >>>
What Happened?
Amazon stock fell about 18% in the last 30 days, recently trading near $199 per share, as valuation multiples compressed across large-cap technology stocks and investors reacted to insider selling and a notable analyst price target cut.
The stock moved lower after Douglas Herrington, CEO of Worldwide Amazon Stores, sold 1,000 shares at an average price of $208 for $208,000, trimming his stake by 0.20% to 504,934 shares worth about $105.0 million.
While the transaction was modest relative to his total holdings, insider sales during a broader market pullback often reinforce short-term caution.
Analyst activity added to the weakness. New Street Research cut its price target on Amazon to $285 from $350 while maintaining a Buy rating, implying roughly 42.8% upside from the recent share price near $199.60.
The reduction reflected more conservative valuation assumptions despite management emphasizing strong cloud demand, with CEO Andy Jassy stating the company is “monetizing capacity as fast as we can install it.”
Institutional filings showed mixed positioning. Trek Financial LLC increased its stake by 12.6% to 59,254 shares valued at about $13.01 million, while Mn Services Vermogensbeheer B.V. raised its holdings to 2,832,500 shares worth approximately $621.9 million.
Meanwhile, Modera trimmed its stake by 2.2% to 242,300 shares valued at about $53.2 million, and Baillie Gifford reduced its position by 4.9% to 31,659,114 shares valued near $6.95 billion. Overall, about 72.2% of Amazon shares remain held by hedge funds and institutional investors.
See analysts’ growth forecasts and price targets for Amazon (It’s free) >>>
Is Amazon Undervalued?
Under valuation assumptions, the stock is modeled using:
- Revenue Growth (CAGR): 12.1%
- Operating Margins: 14.4%
- Exit P/E Multiple: 25.8x
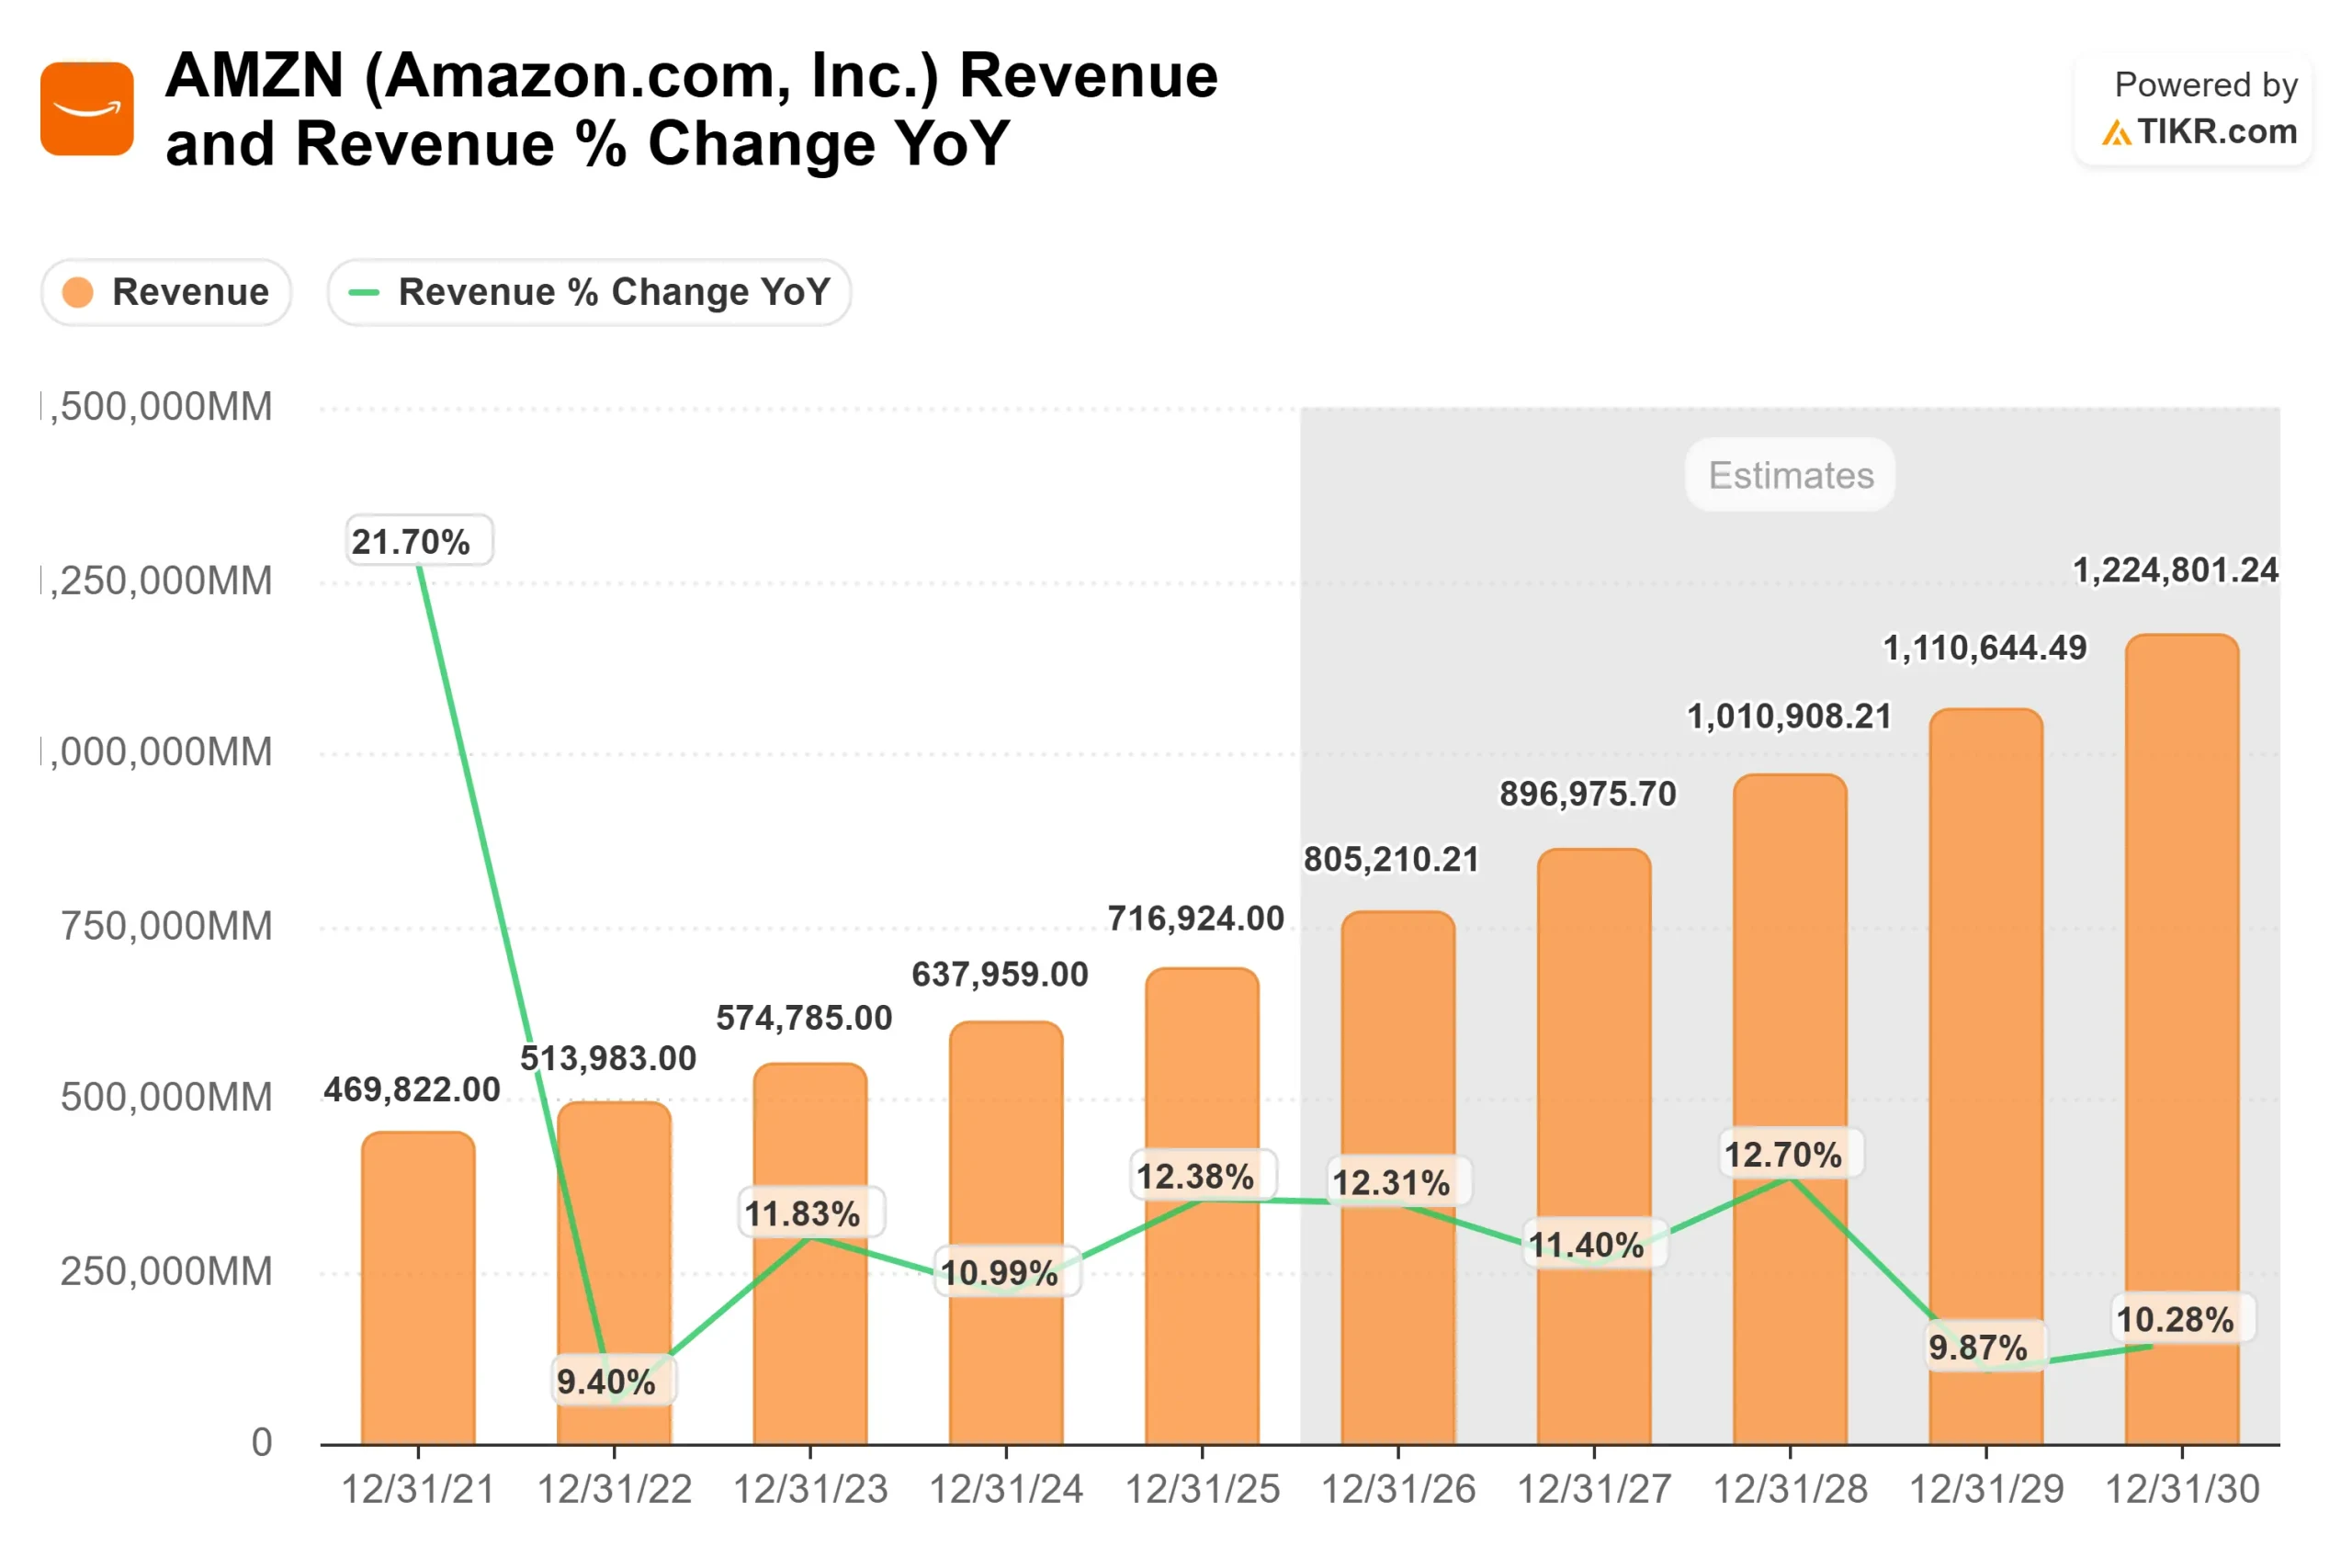
Revenue is projected to grow from $637,959 million in 2024 to $716,924 million in 2025 and $805,210 million in 2026, reflecting forward growth rates of 12.38% and 12.31%.
Growth is supported by AWS acceleration, advertising expansion, and continued strength in third-party seller services.
AWS revenue reached $35.6 billion in Q4 and grew 24% year over year, bringing the segment to a $142 billion annualized run rate.
AWS backlog rose to $244 billion, up 40% year over year, signaling strong enterprise demand across cloud and AI workloads.
Operating margin expansion toward 14.4% assumes continued mix shift toward higher-margin AWS and advertising revenue, fulfillment productivity gains from regionalization and automation, and operating leverage as infrastructure investments scale.
Forward estimates call for EBITDA growth of 23.8% versus revenue growth of 11.9%, highlighting margin-driven earnings expansion.
Advertising revenue reached $21.3 billion in Q4, up 22% year over year, while same-day delivery expansion, grocery penetration, Prime Video ads, and adoption of custom silicon like Trainium and Graviton provide additional high-margin growth drivers.
Based on these inputs, the model estimates a target price of $315.35, implying 58.6% total upside from the recent price near $198.79 over roughly 2.9 years.
At current levels, Amazon appears undervalued, with future performance likely driven by AI infrastructure leadership, advertising monetization, logistics efficiency gains, and sustained operating leverage rather than aggressive revenue acceleration alone.
Estimate a company’s fair value instantly (Free with TIKR) >>>
Value Any Stock in Under 60 Seconds (It’s Free)
With TIKR’s new Valuation Model tool, you can estimate a stock’s potential share price in under a minute.
All it takes is three simple inputs:
- Revenue Growth
- Operating Margins
- Exit P/E Multiple
From there, TIKR calculates the potential share price and total returns under Bull, Base, and Bear scenarios so you can quickly see whether a stock looks undervalued or overvalued.
If you’re not sure what to enter, TIKR automatically fills in each input using analysts’ consensus estimates, giving you a quick, reliable starting point.
See a stock’s true value in under 60 seconds (Free with TIKR) >>>