
Key Takeaways:
- Leadership Reset: The Kroger Co. appointed former Walmart executive Greg Foran as CEO with $1 million base salary and $12 million long-term incentives, marking a governance shift after abandoning a $25 billion Albertsons deal.
- E-Commerce Inflection: The Kroger Co. expects $400 million in 2026 e-commerce profit improvement after closing 3 fulfillment centers, positioning digital sales at 11% of revenue for margin stabilization.
- Price Target Outlook: Based on 2% revenue growth, 3% operating margins, and a 12x exit multiple, The Kroger Co. stock could reach $76 by January 2028 from $69 today.
- Return Profile: The Kroger Co. implies 11% total upside from $69 to $76 over 2 years, equating to a 5% annualized return under conservative margin and multiple assumptions.
Breaking Down the Case for Kroger Co.
he Kroger Co. (KR) appointed Greg Foran as CEO on February 9, 2026, reaffirmed FY2025 EPS guidance of $4.75 to $4.80, and signaled $400 million in 2026 e-commerce profit improvement after closing 3 fulfillment centers.
KR stock rose 8% intraday on the announcement before closing up 1%, reflecting investor focus on leadership credibility and reaffirmed revenue guidance of $147 billion amid a cautious consumer backdrop.
Meanwhile, its revenue totaled $147 billion over the last twelve months, identical sales without fuel grew 3%, and e-commerce sales increased 17%, while pharmacy and digital channels led unit growth.
Gross margin expanded 49 basis points year over year in Q3, operating profit reached $1.1 billion, adjusted EPS grew 7% to $1.05, and net leverage remained disciplined at 1.7x EBITDA.
Management expects $400 million in incremental 2026 e-commerce profit and stated, “We expect these decisions to contribute approximately $400 million in e-commerce profitability improvements in 2026,” anchoring margin expansion to structural fulfillment changes.
The company plans 14 new store groundbreakings in Q4 and a 30% increase in new store builds in 2026, redirecting capital from automation toward higher return physical expansion.
Capital allocation remains active with $5 billion in accelerated share repurchases completed and $2.5 billion remaining under authorization, supporting an 8% to 11% long-term shareholder return objective.
With stocks at $69 and a modeled $76 target implying 11% upside and 5% annualized returns, the debate centers on whether 3% operating margins and 12x earnings fully capture execution risk and digital stabilization.
What the Model Says for KR Stock
Leadership transition to Greg Foran and a sharpened focus on store execution, digital scale, and cost control redefine Kroger’s near-term priorities, yet a structurally low-margin 3.3% operating profile and heavy price investment limit valuation expansion.
The model embeds 1.7% revenue growth, which sits below the 5-year 3.8% historical CAGR, as management narrows identical sales guidance to 2.8% to 3.0% while facing pharmacy reimbursement headwinds and selective consumer spending.
Operating margins hold at 3.3%, in line with the 1-year 3.3% level, reflecting disciplined gross margin management, $400 million in expected e-commerce profit improvement, and ongoing reinvestment into price and store standards.
The 12.1x exit multiple sits below the recent 13.2x NTM P/E market assumption, recognizing that incremental profitability gains and leadership change do not yet justify sustained multiple expansion.

Under these assumptions, Kroger reaches a $76.14 target price by 1/31/28, implying 10.9% total upside and a 5.4% annualized return from $68.66, which falls short of a 10% equity hurdle rate.
Given modest 1.7% growth, flat 3.3% margins, and a compressed 12.1x multiple, the model signals a Sell as risk-adjusted returns favor capital preservation over meaningful appreciation.
Our Valuation Assumptions
TIKR’s Valuation Model lets you plug in your own assumptions for a company’s revenue growth, operating margins, and P/E multiple, and calculates the stock’s expected returns.
Here’s what we used for Kroger stock:
1. Revenue Growth: 1.7%
Kroger stock generated $147 billion in revenue over the last twelve months, yet posted -1.9% 1-year growth as price investment and deflation offset unit stability.
Five-year revenue CAGR of 3.8% and 10-year CAGR of 3.1% show structural maturity, as incremental share gains come from mix shifts rather than footprint expansion.
Digital initiatives and private label expansion support traffic retention, yet e-commerce penetration still represents a modest portion of total sales and carries thinner margins.
Greg Foran’s appointment signals sharper execution focus, yet grocery remains a high-frequency, low-growth category where competitive pricing resets volume assumptions quickly.
Sustaining 1.7% growth requires stable customer retention and disciplined promotions, and any escalation in price competition compresses revenue given limited category elasticity.
This is below the 5-year revenue growth of 3.8%, because scale saturation limits incremental expansion, and valuation therefore capitalizes steady but constrained top-line contribution.
2. Operating Margins: 3.3%
Kroger stock reported 3.2% operating margins in LTM, compared with 3.3% one year ago and a 5-year average of 2.4% during investment-heavy cycles.
Gross margin improved to 24.0% from 22.7% three years earlier, yet operating expenses reached $30.6 billion, absorbing much of the gross profit expansion.
Foran’s background at Walmart U.S. emphasizes store standards and cost discipline, yet labor intensity and fulfillment costs cap structural margin expansion.
Maintaining 3.3% margins assumes disciplined promotions and stable shrink levels, while automated fulfillment investments and union negotiations introduce variability.
Any deviation of 50 basis points in operating margin materially affects net income due to thin absolute profitability on $147 billion of revenue.
This is in line with the 1-year operating margin of 3.3%, because pricing discipline offsets cost inflation, and valuation embeds stability rather than structural improvement.
3. Exit P/E Multiple: 12.1x
Kroger stock trades at 13.25× NTM Price / Normalized Earnings based on the 2026 market assumption, while the model applies a 12.1× terminal multiple.
The 12.1× multiple capitalizes normalized earnings under low-growth conditions, consistent with a defensive grocery profile and limited long-term expansion potential.
Revenue growth of 1.7% and operating margins of 3.3% already assume steady execution, and applying a higher multiple would layer optimism onto stabilized fundamentals.
Free cash flow yield of 6.7% and dividend yield of 2.1% anchor shareholder return expectations around income rather than growth re-rating.
If competitive intensity rises or execution under new leadership falters, earnings durability weakens and multiple compression occurs faster than expansion.
This is below the 1-year P/E of 13.18× and below the 2026 market assumption of 13.25×, because earnings growth remains constrained, and valuation assumes normalization rather than re-rating.
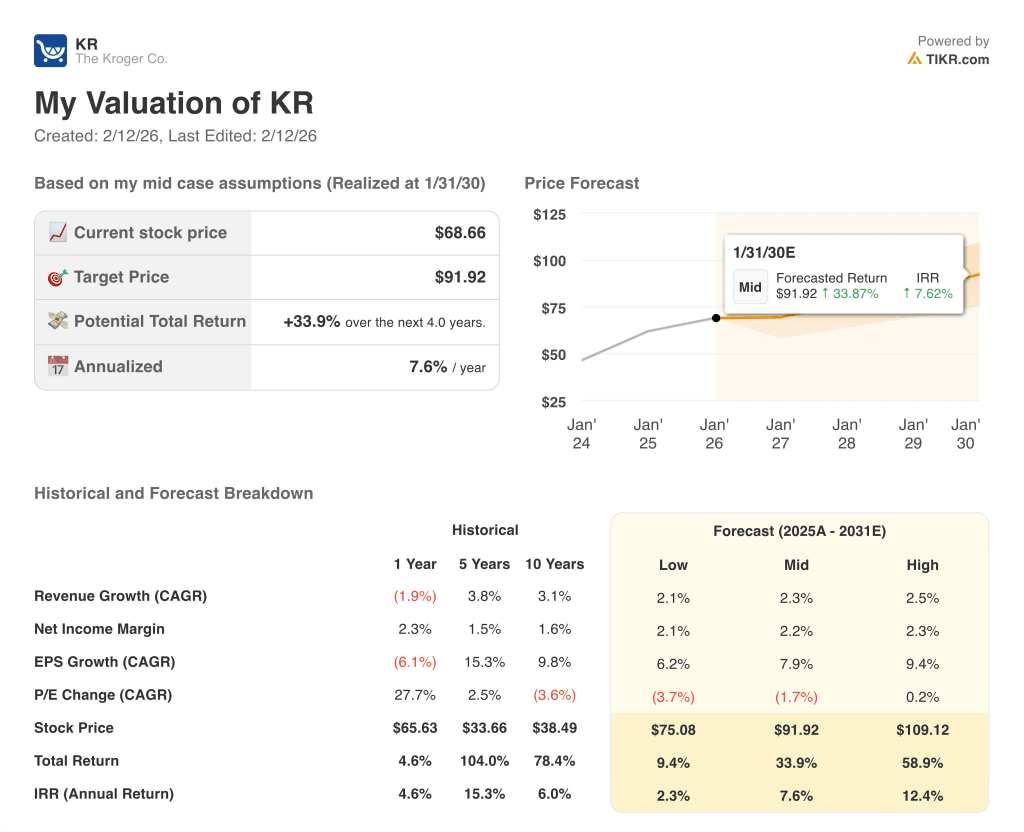
What Happens If Things Go Better or Worse?
Kroger stock results hinge on pricing discipline, private label traction, and digital fulfillment efficiency, shaping business direction through 1/31/30.
- Low Case: If price competition intensifies and digital costs remain elevated, revenue grows 2.1% and net margin holds 2.1% → 2.3% annualized return.
- Mid Case: With steady traffic and disciplined promotions, revenue grows 2.3% and net margin reaches 2.2% → 7.6% annualized return.
- High Case: If execution under Greg Foran lifts productivity and digital leverage improves, revenue grows 2.5% and net margin reaches 2.3% → 12.4% annualized return.
How Much Upside Does Kroger Stock Have From Here?
With TIKR’s new Valuation Model tool, you can estimate a stock’s potential share price in under a minute.
All it takes is three simple inputs:
- Revenue Growth
- Operating Margins
- Exit P/E multiple
If you’re not sure what to enter, TIKR automatically fills in each input using analysts’ consensus estimates, giving you a quick, reliable starting point.
From there, TIKR calculates the potential share price and total returns under Bull, Base, and Bear scenarios so you can quickly see whether a stock looks undervalued or overvalued.
Looking for New Opportunities?
- See what stocks billionaire investors are buying so you can follow the smart money.
- Analyze stocks in as little as 5 minutes with TIKR’s all-in-one, easy-to-use platform.
- The more rocks you overturn… the more opportunities you’ll uncover. Search 100K+ global stocks, global top investor holdings, and more with TIKR.
Disclaimer:
Please note that the articles on TIKR are not intended to serve as investment or financial advice from TIKR or our content team, nor are they recommendations to buy or sell any stocks. We create our content based on TIKR Terminal’s investment data and analysts’ estimates. Our analysis might not include recent company news or important updates. TIKR has no position in any stocks mentioned. Thank you for reading, and happy investing!