Key Stats for Apple Stock
- Past-Week Performance: -8%
- 52-Week Range: $169 to $289
- Valuation Model Target Price: $336
- Implied Upside: 29%
Value your favorite stocks like Apple with 5 years of analysts’ forecasts using TIKR’s new Valuation Model (It’s free) >>>
What Happened?
Apple stock fell about 8% this week, finishing near $260 per share, as investors focused on near-term iPhone supply constraints and advanced-node capacity limitations despite record quarterly results and strong forward guidance.
The decline reflects short-term supply concerns rather than deterioration in operating performance.
The stock pulled back even after Apple reported its “best-ever quarter,” delivering $143.8 billion in revenue, up 16% year over year, driven by iPhone revenue of $85.3 billion that climbed 23% and pushed EPS to a record $2.84, up 19%.
Services reached an all-time high of $30 billion, up 14%, while the installed base surpassed 2.5 billion active devices and operating cash flow hit a record $53.9 billion.
CFO Kevan Parekh guided March-quarter revenue growth of 13% to 16% year over year with gross margin of 48% to 49%, although CEO Tim Cook said Apple is “in a supply chase mode” due to advanced-node constraints following stronger-than-expected iPhone demand.
Institutional activity showed selective trimming but continued conviction in Apple as a core holding. Maryland State Retirement & Pension System raised its stake 1.5% to 725,203 shares worth $184.66 million, while Meitav Investment House increased its position 15.7% to 81,162 shares valued at $20.67 million.
Nippon Life Global Investors Americas reduced its stake 7.9% to 340,060 shares worth $86.59 million, reflecting portfolio rebalancing rather than broad institutional exit.
Despite supply constraints, Apple said it believes it gained smartphone share during the December quarter.
Record profitability, double-digit iPhone growth, expanding Services margins, and disciplined capital returns highlight that this week’s weakness was driven more by near-term supply friction and rising memory pricing than by weakening demand.
See analysts’ growth forecasts and price targets for Apple (It’s free) >>>
Is Apple Undervalued?
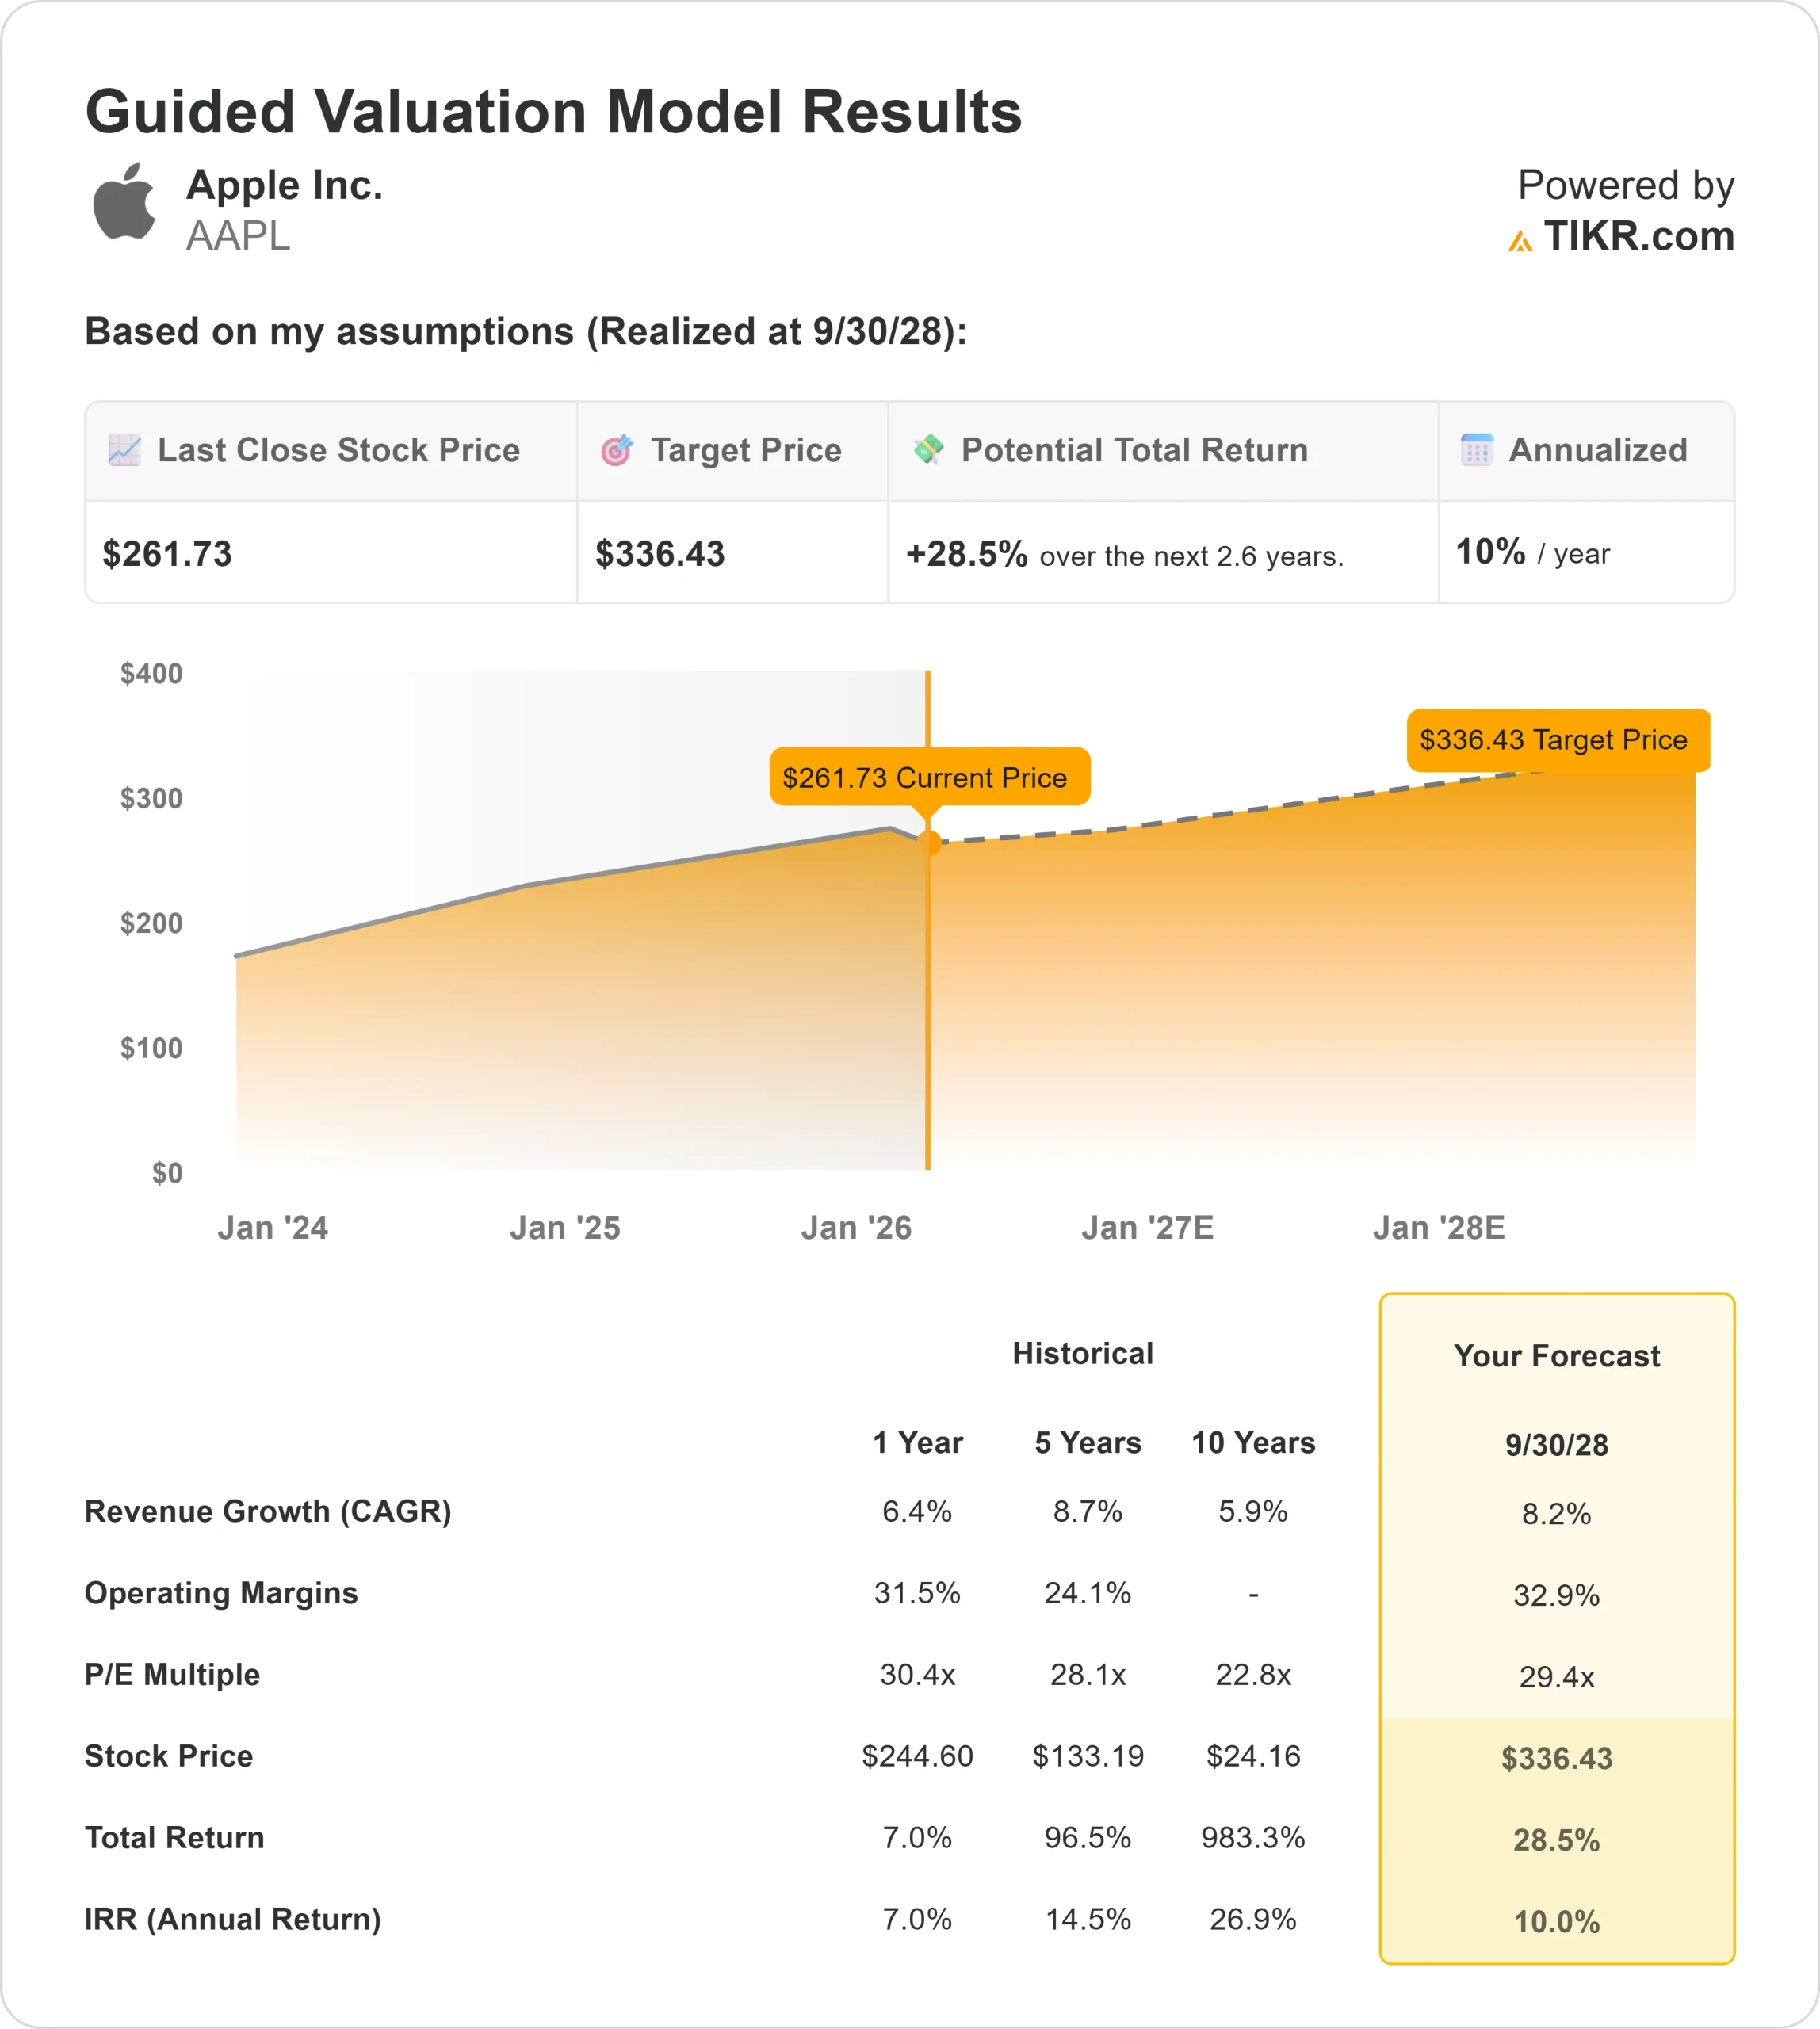
Under valuation assumptions, the stock is modeled using:
- Revenue Growth (CAGR): 8.2%
- Operating Margins: 32.9%
- Exit P/E Multiple: 29.4x
Revenue is projected to grow from $416 billion in fiscal 2025 toward roughly $465 billion in fiscal 2026 and continue expanding from there based on analyst estimates, reflecting mid-single-digit hardware growth supported by continued Services expansion.

With more than 2.5 billion active devices, Apple has one of the largest installed bases in the world, creating recurring monetization opportunities across subscriptions, payments, advertising, cloud services, and digital content.
Services already delivered a record $30 billion quarter with 14% growth, and continued mix shift toward higher-margin segments supports operating leverage even if hardware supply remains constrained.
This supports the view that future returns depend more on ecosystem monetization, pricing power, and margin durability than on a single hardware upgrade cycle.
Based on these inputs, the model estimates a target price of $336, implying about 29% total upside, indicating the stock appears undervalued at current levels.
Results over the next year hinge on supply normalization in advanced nodes, sustained iPhone demand strength, AI integration across Apple’s platforms including personalized Siri features, and continued capital returns funded by $53.9 billion in operating cash flow.
At current levels, Apple appears undervalued, with future performance driven by earnings quality, Services expansion, AI-enabled engagement, and disciplined capital allocation rather than speculative revenue acceleration.
Estimate a company’s fair value instantly (Free with TIKR) >>>
Value Any Stock in Under 60 Seconds (It’s Free)
With TIKR’s new Valuation Model tool, you can estimate a stock’s potential share price in under a minute.
All it takes is three simple inputs:
- Revenue Growth
- Operating Margins
- Exit P/E Multiple
From there, TIKR calculates the potential share price and total returns under Bull, Base, and Bear scenarios so you can quickly see whether a stock looks undervalued or overvalued.
If you’re not sure what to enter, TIKR automatically fills in each input using analysts’ consensus estimates, giving you a quick, reliable starting point.
See a stock’s true value in under 60 seconds (Free with TIKR) >>>