

Key Stats for Johnson & Johnson Stock
- Past-Week Performance: +2.4%
- 52-Week Range: $141.5 to $251.7
- Current Price: $246.8
What Happened?
Johnson & Johnson stock (JNJ) trades just 2% below its 52-week high of $251.71, yet the stock’s restraint understates a company that cleared $94.2 billion in 2025 revenue while simultaneously building its most diversified pipeline in history.
On March 3, the FDA granted Fast Track designation to nipocalimab for systemic lupus erythematosus, backed by Phase 2b JASMINE data showing reduced disease activity across 228 adults, adding a third approved-or-filed indication for the same asset.
Underneath that catalyst, J&J posted adjusted diluted EPS of $2.46 in Q4, up 20.6% year-over-year, while MedTech margins expanded from 10.8% to 17.4% and Innovative Medicine margins improved from 32.5% to 36.3% in the same quarter.
Joaquin Duato, Chairman and CEO, stated on the Q4 earnings call that “we have line of sight to double-digit growth by the end of the decade,” a claim now reinforced by TREMFYA crossing $5 billion in full-year sales and targeting $10 billion at peak.
With 28 platforms already generating $1 billion or more annually, a $21 billion free cash flow target for 2026, nipocalimab expanding across SLE and WAIHA, and OTTAVA’s FDA decision expected by early next year, J&J enters a multi-year compounding window that its current price has not yet priced in.
Wall Street’s Take on JNJ Stock
The FDA’s March 3 Fast Track designation for nipocalimab in SLE, layered onto its February 24 WAIHA filing, confirms a multi-indication biologics platform that directly expands J&J’s addressable revenue well beyond current consensus models.
Revenue grows from $94.2 billion in 2025 to an estimated $100.6 billion in 2026, while normalized EPS climbs from $10.79 to $11.53 and EBITDA margins expand from 35.3% to 36.7%, confirming steady fundamental acceleration rather than a one-year bounce.
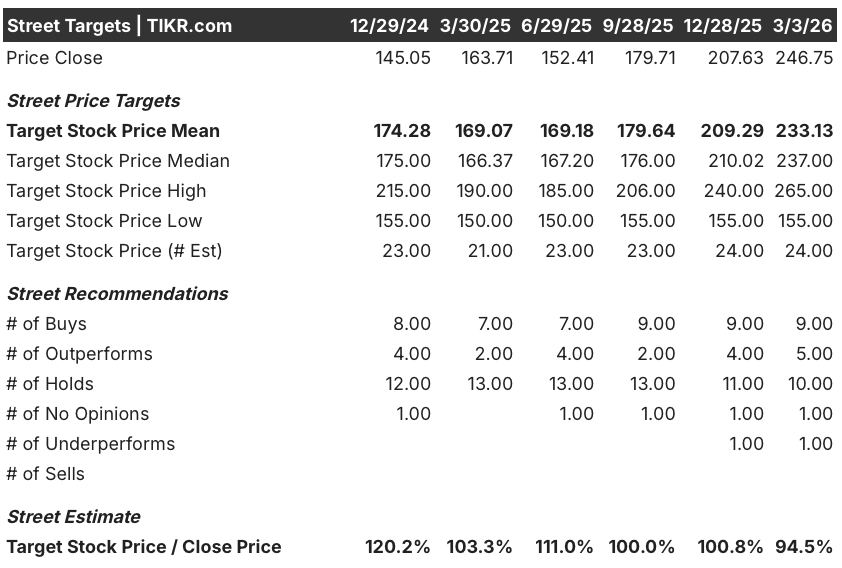
Wall Street carries 9 buys, 5 outperforms, 10 holds, and 1 underperform, with a mean price target of $233.13, implying 5.5% downside from $246.75, suggesting analysts are not yet upgrading into the stock’s recent strength and remain cautious ahead of upcoming catalysts.
The analyst target range spans $155 to $265, where the low reflects talc litigation escalation and DePuy Synthes separation disruption, while the high requires nipocalimab approvals across multiple indications and OTTAVA’s U.S. launch driving surgical robotics revenue from 2027 onward.
What Does the Valuation Model Say?

The mid-case valuation model prices JNJ at $299.57 by December 2030, implying a 21.4% total return and a 4.1% annualized IRR from current levels. That modest IRR reflects the market’s skepticism about J&J’s ability to accelerate beyond its current 6% revenue growth trajectory.
The market prices JNJ as a slow-growth healthcare conglomerate, yet excluding STELARA, Innovative Medicine grew nearly 15% in 2025. J&J has now overcome two major loss-of-exclusivity events, REMICADE in 2018 and STELARA in 2025, a feat no other company has matched. CFO Joe Wolk confirmed at the TD Cowen conference that consensus remains “a little shy” on cardiovascular and surgery estimates through 2028 and 2029.
The DePuy Synthes sale at $20 billion-plus would add ~75 basis points of margin and growth to the remaining portfolio, a re-rating event the current $246.75 price does not reflect.
The talc MDL Daubert ruling is still under appeal, and ongoing litigation costs already drove $0.9 billion in Q4 other expense, a liability the market continues to discount against the operating story.
The April 14 Q1 2026 earnings call will either confirm that TREMFYA’s IBD momentum and CARVYKTI’s expansion sustain double-digit growth or force analysts to revisit the $233.13 mean target downward.
JNJ is fairly valued at current prices but becomes a compelling buy if the DePuy sale closes near $20 billion and nipocalimab secures its second approval before year-end.
Should You Invest in Johnson & Johnson?
The only way to really know is to look at the numbers yourself. TIKR gives you free access to the same institutional-quality financial data that professional analysts use to answer exactly that question.
Pull up JNJ stock and you’ll see years of historical financials, what Wall Street analysts expect for revenue and earnings in the quarters ahead, how valuation multiples have moved over time, and whether price targets are trending up or down.
You can build a free watchlist to track Johnson & Johnson alongside every other stock on your radar. No credit card required. Just the data you need to decide for yourself.
Access Professional Tools to Analyze JNJ stock on TIKR for Free →


