Key Stats for RTX Stock
- Past week’s performance: -4.2%
- 52-week range: $124 to $215
- Valuation model target price: $210
- Implied upside: 21.4% over 2.7 years
Value your favorite stocks like RTX with 5 years of analysts’ forecasts using TIKR’s new Valuation Model (It’s free) >>>
What Happened?
RTX Corporation (RTX) slipped this week even after reporting a strong first quarter. The company raised its 2026 adjusted sales and EPS outlook, but the stock still moved lower. That suggests investors are rethinking valuation, costs, and how much good news is already priced in.
RTX reported Q1 sales of $22.1 billion, up 9%, and adjusted EPS of $1.78, up 21%. Management also raised adjusted sales guidance to $92.5 billion to $93.5 billion. CEO Chris Calio said the quarter was driven by execution and backlog delivery across all three segments.
RTX operates across commercial aerospace and defense. Collins Aerospace supplies aircraft systems, Pratt & Whitney makes jet engines, and Raytheon produces missile and defense systems. This mix gives RTX exposure to airline maintenance demand and government defense spending.
The pullback likely reflected caution around costs and valuation. RTX noted tariff pressure in Collins and Pratt & Whitney, even as Raytheon benefited from Patriot, GEM-T, and naval munitions demand. Going forward, the stock will likely depend on whether RTX can turn strong backlog into margin expansion.
See analysts’ growth forecasts and price targets for RTX (It’s free) >>>
Is RTX Stock Undervalued?

Under valuation model assumptions realized through 12/31/28, the stock is modeled using:
- Revenue growth (CAGR): 6.4%
- Operating Margins: 12.9%
- Exit P/E Multiple: 25.1x
Based on these inputs, the model estimates a target price of $210, implying 21.4% total upside from the current share price and a 7.5% annualized return over the next 2.7 years.
RTX does not look deeply undervalued at today’s price. The annualized return is below 10%, so the stock looks more fairly valued than compelling. Investors are paying for stability, backlog visibility, and defense demand rather than explosive growth.
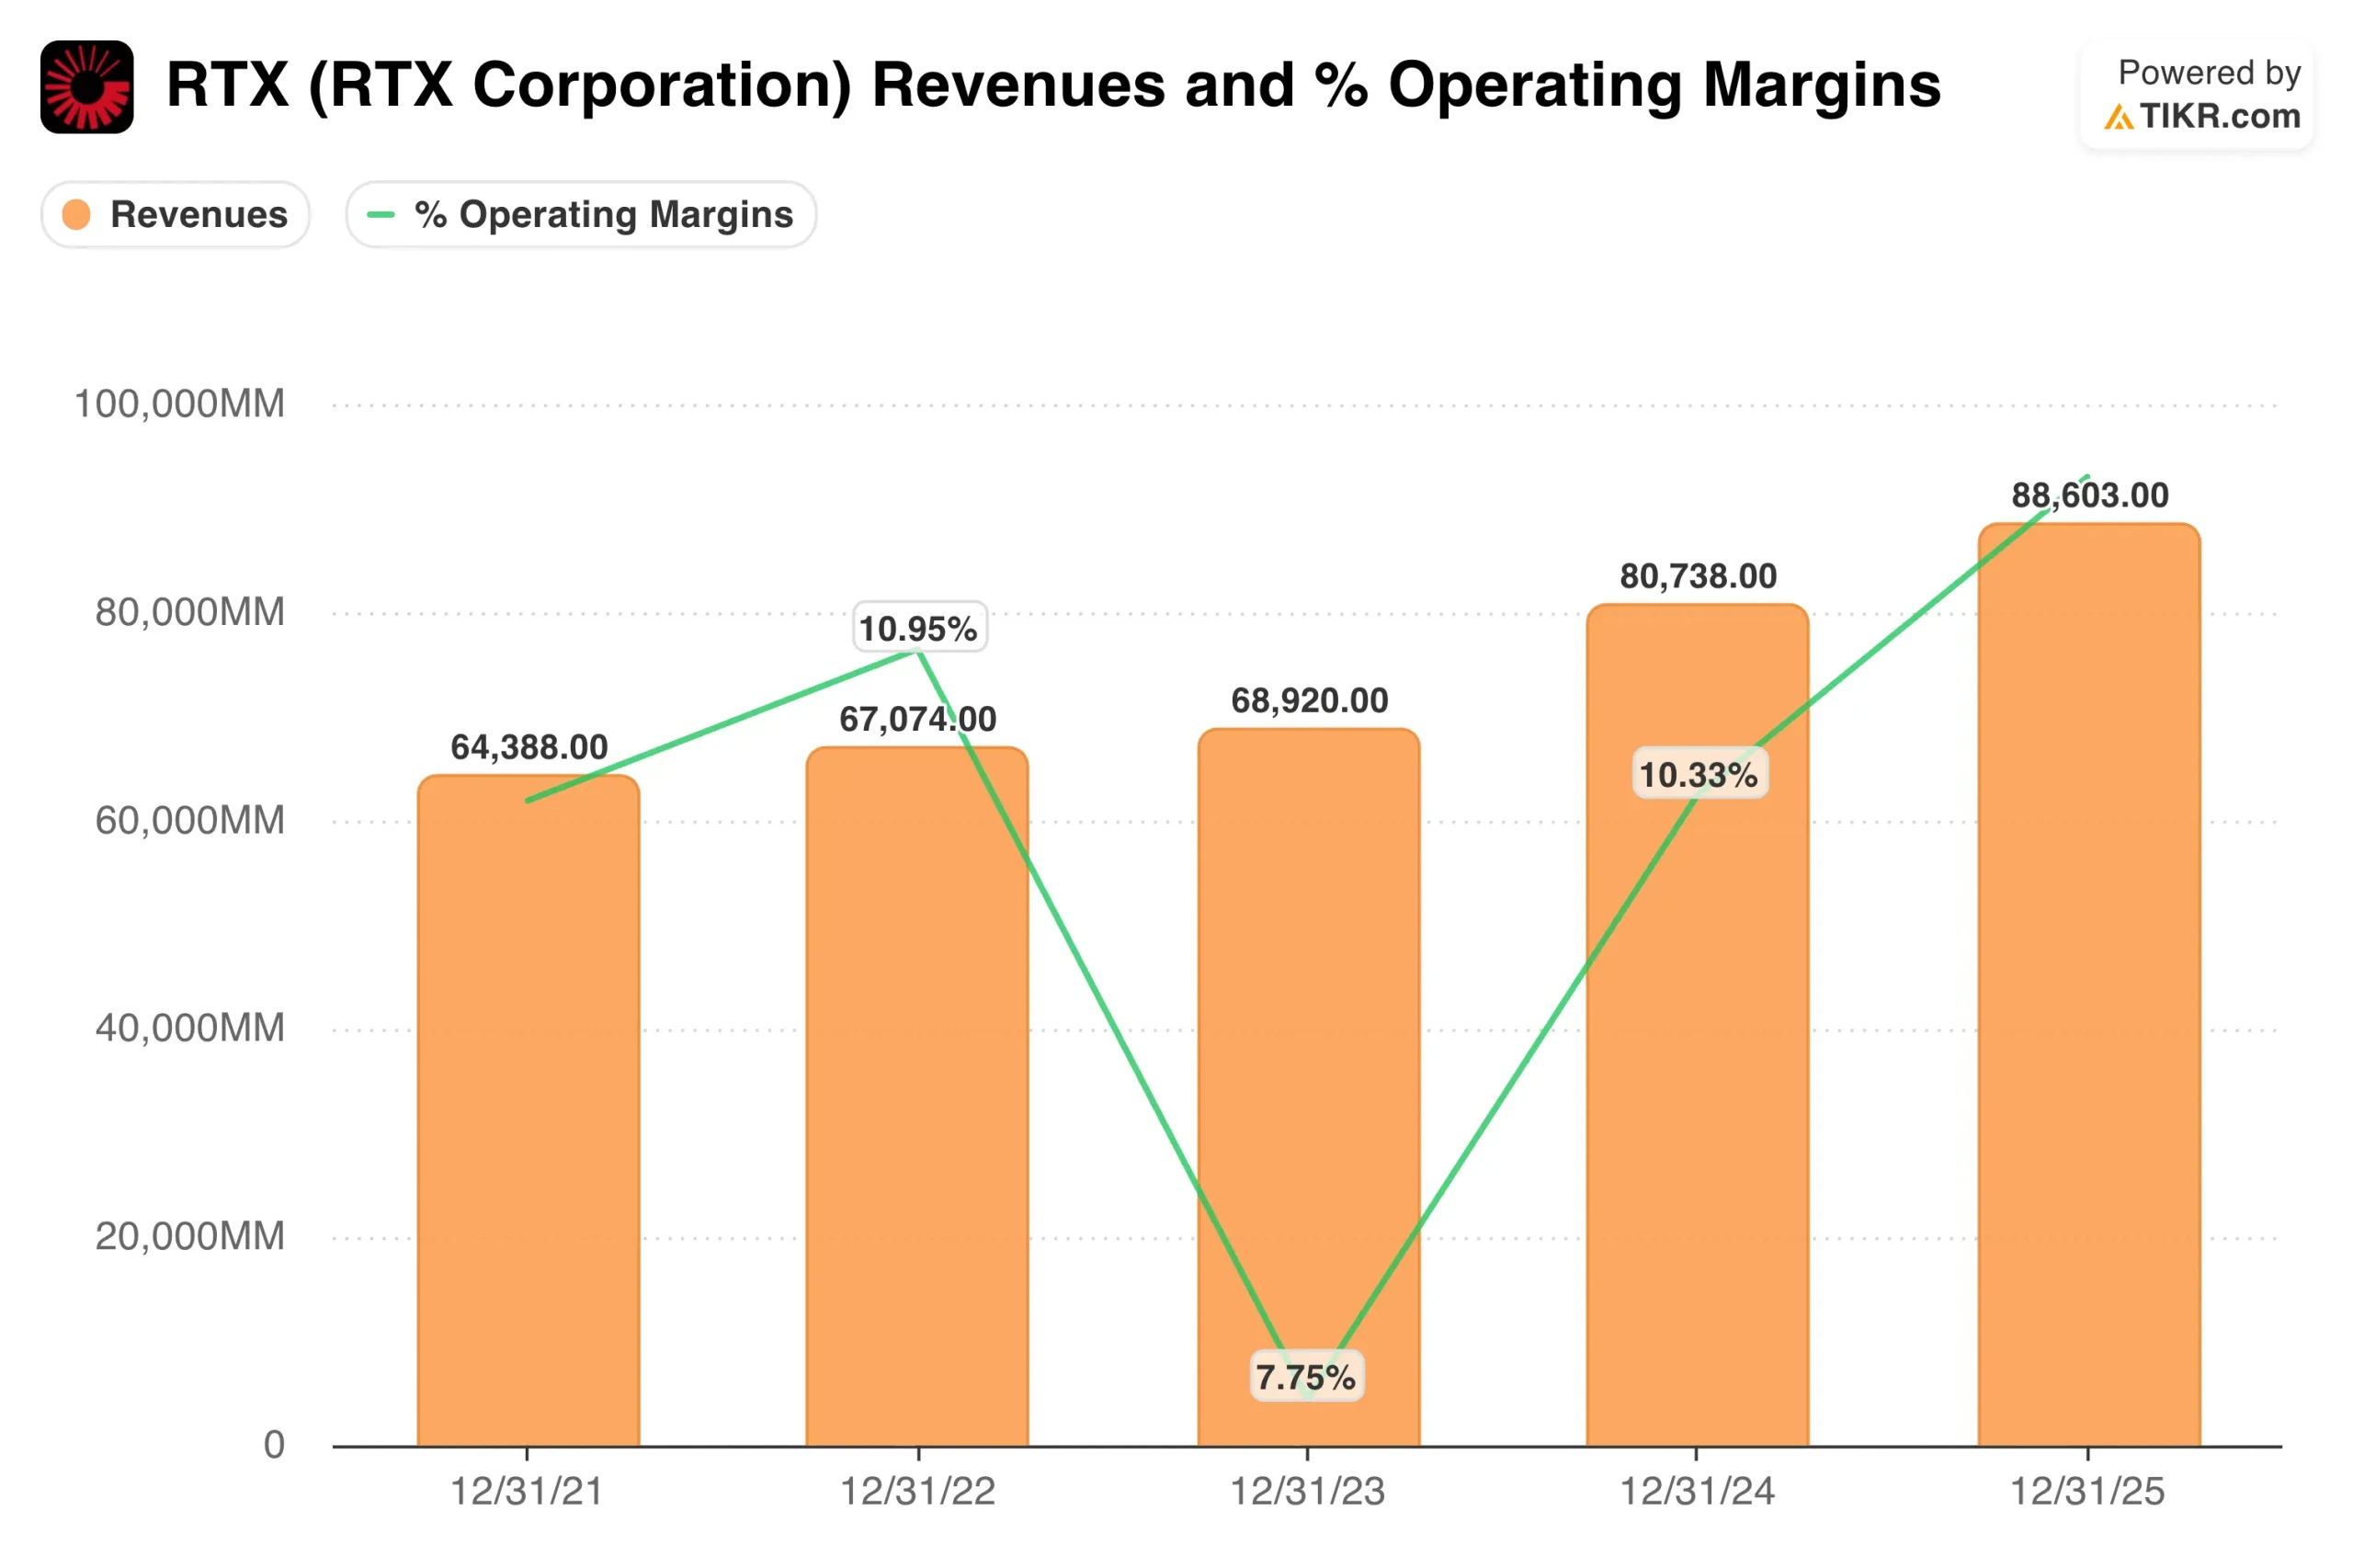
The valuation depends on moderate revenue growth and better margins. RTX has trailing revenue of $90.4 billion and an operating margin of 12.0%, so the model assumes only modest margin improvement. That improvement would likely need to come from higher defense volume, aftermarket growth, and better productivity.
The balance sheet also matters. RTX has $32.1 billion of net debt, or 2.0x EBITDA, so cash flow must support dividends, debt reduction, and investment. Free cash flow of $8.5 billion gives the company flexibility, but valuation upside may stay limited if cost pressure remains high.
What’s Driving RTX Stock Going Forward?
Defense demand is the biggest near-term driver. Raytheon sales rose 10% in Q1, helped by land and air defense systems, including Patriot and GEM-T. Those systems matter because governments are replenishing missile inventories and strengthening air defense.
Pratt & Whitney is another important catalyst. The segment grew sales 11%, helped by a 19% increase in commercial aftermarket revenue. Aftermarket revenue is important because engines need parts, repairs, and maintenance across their operating life.
Recent contract wins also support the outlook. Pratt & Whitney received a $6.6 billion F135 production contract for F-35 engine lots 18 and 19. The company said it is investing across production and its supply chain to meet F-35 demand.
The next key event is RTX’s annual meeting on April 30. Investors will also watch tariffs, defense budgets, airline maintenance demand, and progress on the Pratt & Whitney GTF inspection program. If RTX can protect margins while delivering against its $271 billion backlog, sentiment could improve.
Estimate a company’s fair value instantly (Free with TIKR) >>>
Should You Invest in RTX Corporation?
The only way to really know is to look at the numbers yourself. TIKR gives you free access to the same institutional-quality financial data that professional analysts use to answer exactly that question.
Pull up RTX, and you’ll see years of historical financials, what Wall Street analysts expect for revenue and earnings in the quarters ahead, how valuation multiples have moved over time, and whether price targets are trending up or down.
You can build a free watchlist to track RTX alongside every other stock on your radar. No credit card required. Just the data you need to decide for yourself.
Analyze RTX stock on TIKR Free→
Looking for New Opportunities?
- See what stocks billionaire investors are buying so you can follow the smart money.
- Analyze stocks in as little as 5 minutes with TIKR’s all-in-one, easy-to-use platform.
- The more rocks you overturn… the more opportunities you’ll uncover. Search 100K+ global stocks, global top investor holdings, and more with TIKR.
Disclaimer:
Please note that the articles on TIKR are not intended to serve as investment or financial advice from TIKR or our content team, nor are they recommendations to buy or sell any stocks. We create our content based on TIKR Terminal’s investment data and analysts’ estimates. Our analysis might not include recent company news or important updates. TIKR has no position in any stocks mentioned. Thank you for reading, and happy investing!