Apple is one of the most widely held stocks in the world, and yet its valuation remains one of the most debated.
A company that once traded at 11x to 12x earnings now sits at a trailing P/E of 34.38x and a forward P/E of 31.44x. That re-rating did not happen in a single year. It unfolded gradually as Services revenue grew, the installed base narrative took hold, and investors began treating Apple less like a consumer electronics company and more like a recurring revenue platform.
What the multiple means today depends almost entirely on whether you believe the shift in perception was warranted and whether the earnings trajectory ahead justifies the current price.
Now Live: Discover how much upside your favorite stocks could have using TIKR’s new Valuation Model (It’s free)>>>
Apple’s Current P/E in Context
At 34.38x trailing earnings, Apple (AAPL) trades at one of the higher multiples among large-cap technology names. Net income margins are approximately 26%, and the forward P/E of 31.44x reflects analysts’ expectations for continued earnings growth.

The LTM P/E of 34.38x sits well above the ten-year mean of 25.51x. That gap is the central valuation question for anyone looking at Apple today.
One Year: Trading Near the High End of a Tight Range
Over the past twelve months, Apple’s LTM P/E ranged from a low of 30.51x to a high of 41.03x, with a mean of 34.51x.

The stock spiked toward 41x in late 2025 before compressing through early 2026. At the current reading of 34.38x, Apple is essentially trading at its one-year average, suggesting the market has settled into a holding pattern while it waits for clarity on AI monetization and China.
Analyze Apple stock on TIKR Free→
Three Years: Compression, Recovery, and a New Floor
The three-year view shows a low of 25.71x, a high of 42.60x, and a mean of 33.09x.

The compression through 2022 and into early 2023 was real. Rising rates broadly pressured growth multiples, and the trough near 20x reflected genuine skepticism about whether the Services re-rating was durable. The recovery since then has been driven primarily by fundamentals, and the current reading is above the three-year mean.
Five Years: From Pandemic Premium to Settled Expectations
The five-year chart shows a high of 42.60x, a low of 20.46x, and a mean of 30.64x, notably higher than the ten-year mean of 25.51x.

That elevated mean reflects how much the baseline shifted after 2022. Since the trough, Apple has largely traded between 29x and 42x. The consistency of that band suggests the market has formed a settled view of the business, one that will be difficult to disrupt without a meaningful change in the earnings trajectory.
See what analysts think about Apple stock right now (Free with TIKR) >>>
Ten Years: A Multiple That Has Nearly Tripled
The full ten-year view captures the complete re-rating: a low of 10.06x, a high of 43.65x, and a long-run mean of 25.51x.
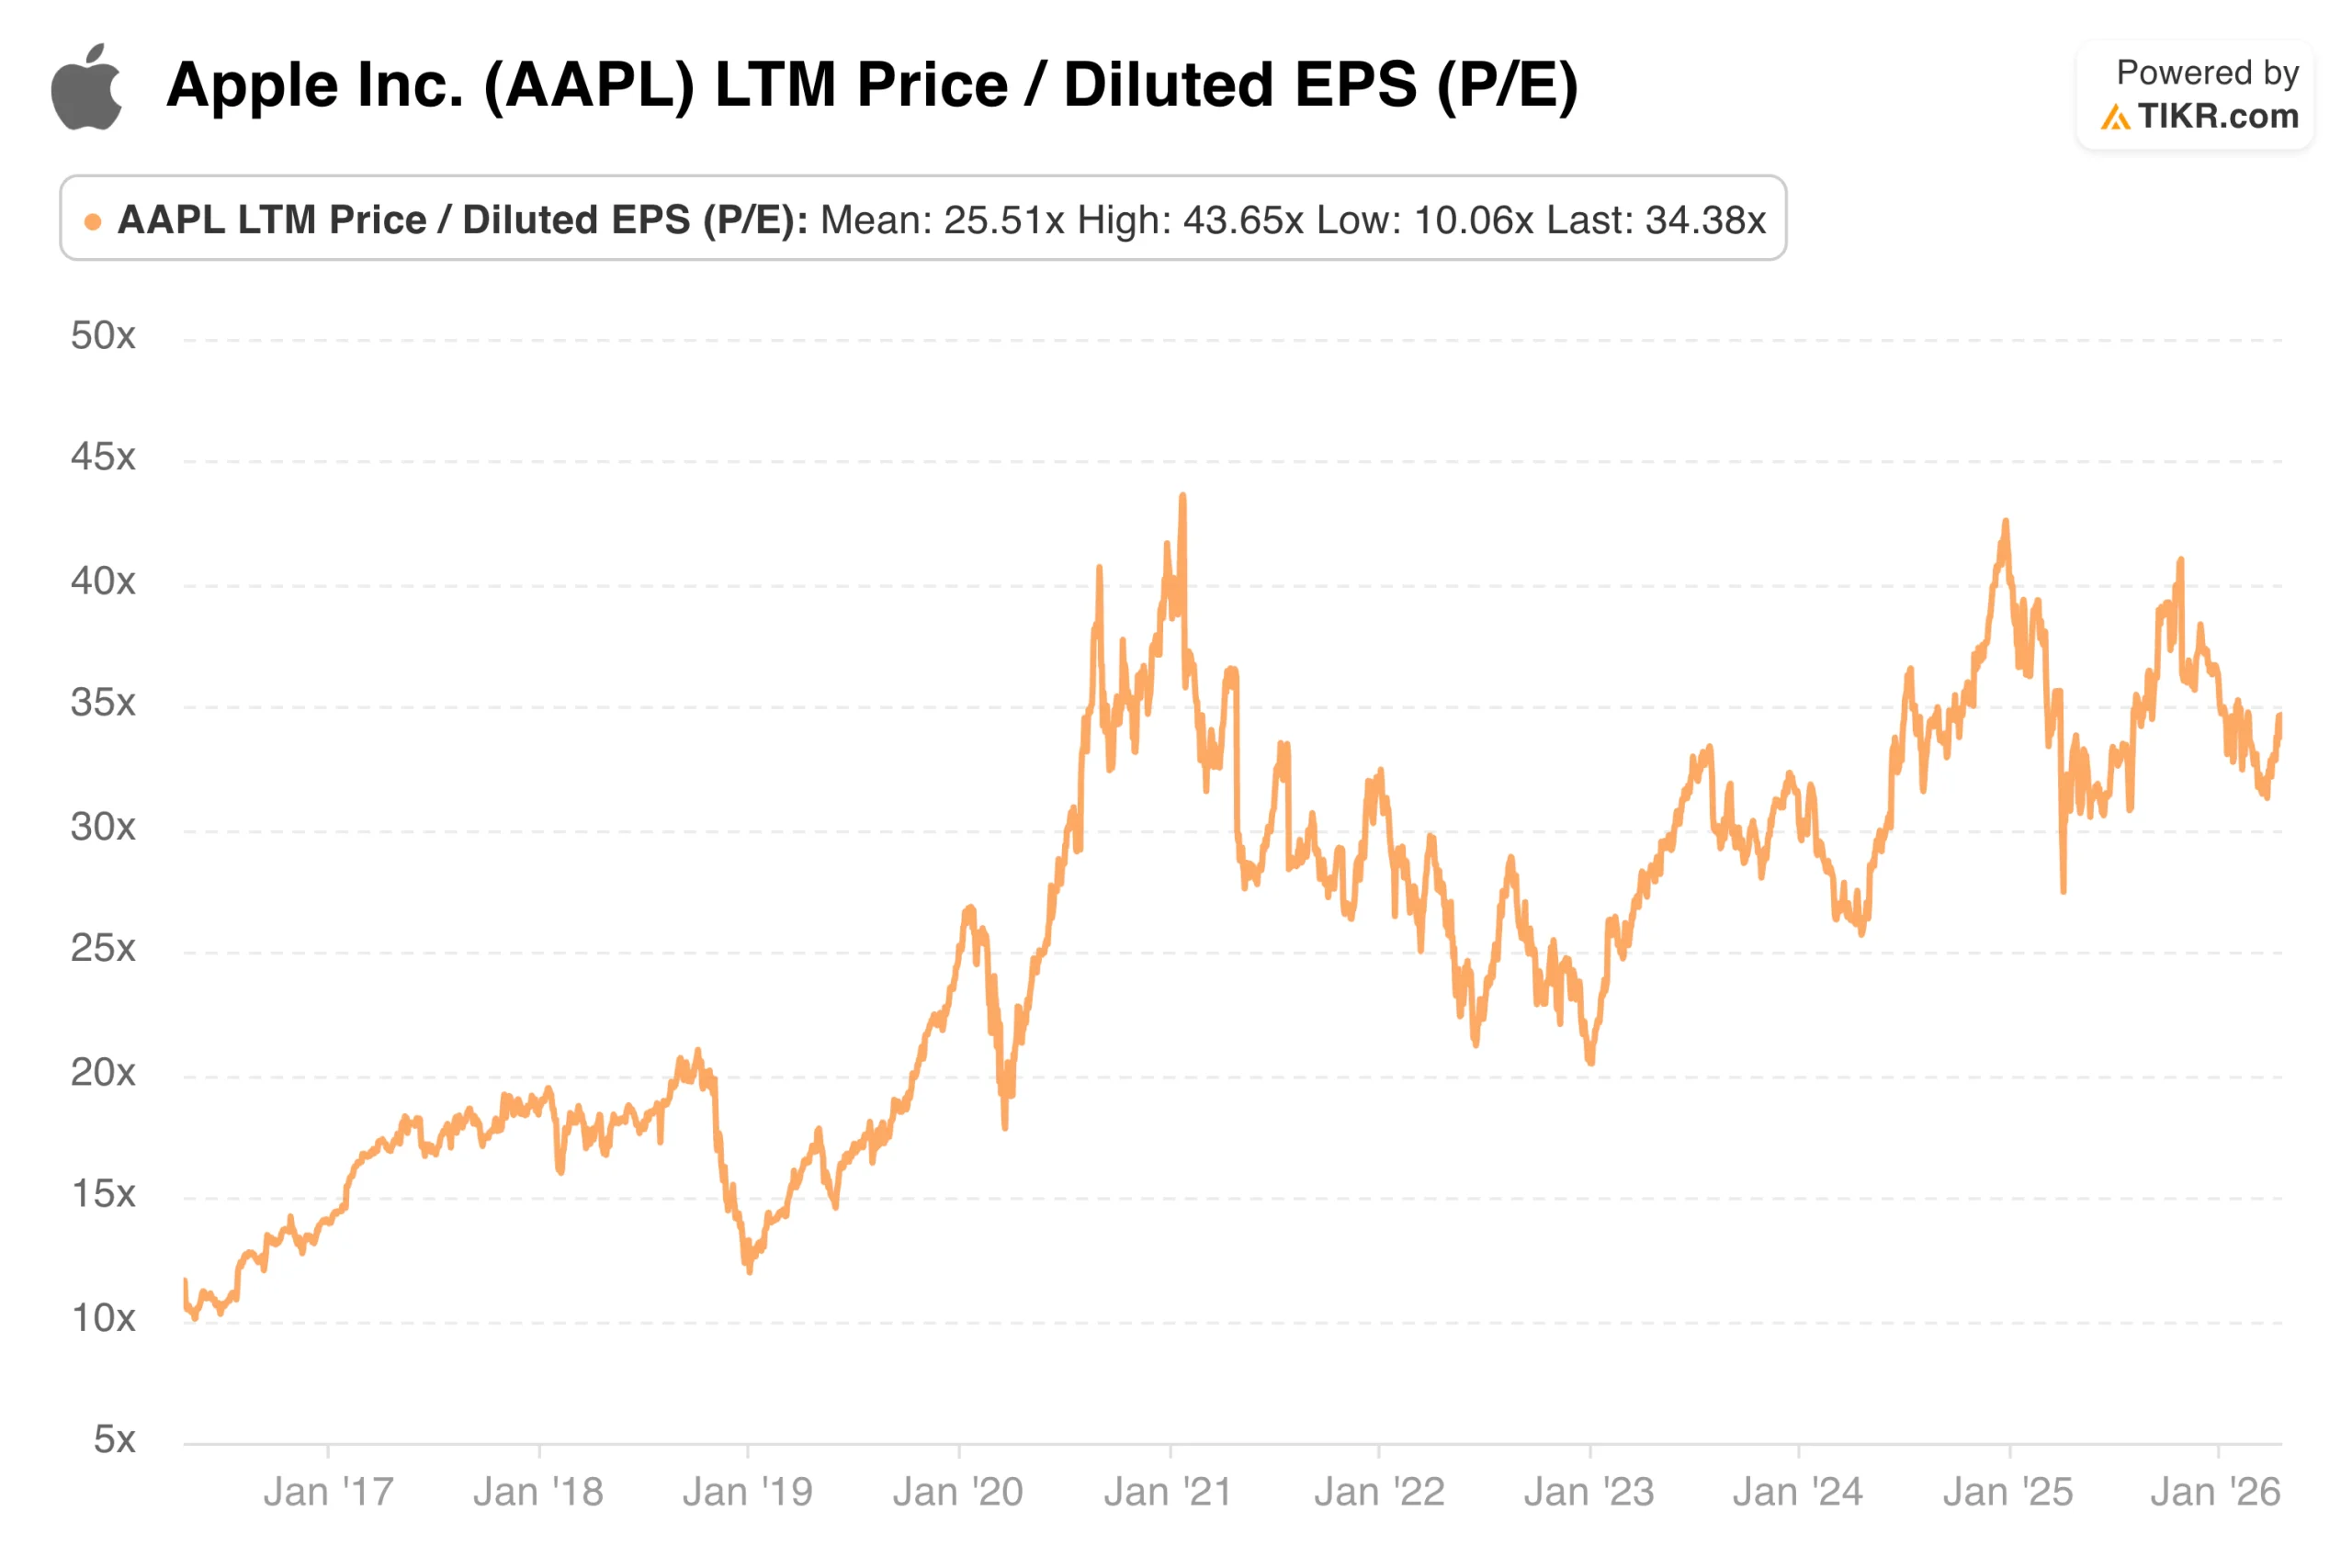
In 2017, Apple traded at a price-to-earnings ratio of 11x to 12x earnings. The decade since has been a story about the market fundamentally reassigning what kind of business Apple is. The long-run mean of 25.51x is now well below where the stock has traded for years, not a level it is at risk of returning to without a serious deterioration in fundamentals.
Bull Case, Bear Case, and What the Model Implies
The bull case does not require optimism. It requires execution. Steady revenue growth, stable margins, and continued Services expansion support a multiple in the low-to-mid 30s without any heroics. The bear case centers on China, where iPhone revenue has been under pressure, and AI monetization, which remains an open question.
The valuation model on TIKR, using mid-case assumptions of 7.5% revenue growth and 27.8% net income margins, points to a target price of $441.79 and an annualized return of approximately 11.6% over the next 4.4 years. The model assumes modest P/E compression of roughly 1.9% annually, implying the return thesis depends on earnings growth rather than multiple expansion.

The base case is reasonable, as Apple at 34x is not cheap, but it is not obviously broken either. The premium reflects what the business has become. Whether it is still justified from here depends almost entirely on what Services growth, AI monetization, and China risk actually mean for earnings over the next several years.
Build your own Valuation Model to value any stock (It’s free!) >>>
How Much Upside Does Apple Stock Have From Here?
With TIKR’s new Valuation Model tool, you can estimate a stock’s potential share price in under a minute.
All it takes is three simple inputs:
- Revenue Growth
- Operating Margins
- Exit P/E Multiple
If you’re not sure what to enter, TIKR automatically fills in each input using analysts’ consensus estimates, giving you a quick, reliable starting point.
From there, TIKR calculates the potential share price and total returns under Bull, Base, and Bear scenarios so you can quickly see whether a stock looks undervalued or overvalued.
See a stock’s true value in under 60 seconds (Free with TIKR) >>>
Looking for New Opportunities?
- See what stocks billionaire investors are buying so you can follow the smart money.
- Analyze stocks in as little as 5 minutes with TIKR’s all-in-one, easy-to-use platform.
- The more rocks you overturn… the more opportunities you’ll uncover. Search 100K+ global stocks, global top investor holdings, and more with TIKR.
Disclaimer:
Please note that the articles on TIKR are not intended to serve as investment or financial advice from TIKR or our content team, nor are they recommendations to buy or sell any stocks. We create our content based on TIKR Terminal’s investment data and analysts’ estimates. Our analysis might not include recent company news or important updates. TIKR has no position in any stocks mentioned. Thank you for reading, and happy investing!