Key Stats: Verizon Communications (VZ) — Q1 2026
- Current price: ~$47
- Q1 2026 revenue: $34.4B, up 2.9% YoY
- Q1 2026 adjusted EPS: $1.28, up 7.6% YoY
- Q1 2026 adjusted EBITDA: $13.4B, up 6.7% YoY; EBITDA margin 38.9%, +140 bps YoY
- Q1 2026 postpaid phone net adds: +55,000 (first positive Q1 since 2013)
- Full-year mobility and broadband service revenue growth guidance: 2% to 3% (reaffirmed)
- Full-year adjusted EPS growth guidance: raised to 5% to 6% (from 4% to 5%)
- Full-year free cash flow guidance: ~7% or more growth (reaffirmed)
- TIKR model price target: $73 (mid case, realized 12/31/30)
- Implied upside from current price: ~55%
Verizon Q1 2026 Earnings Breakdown
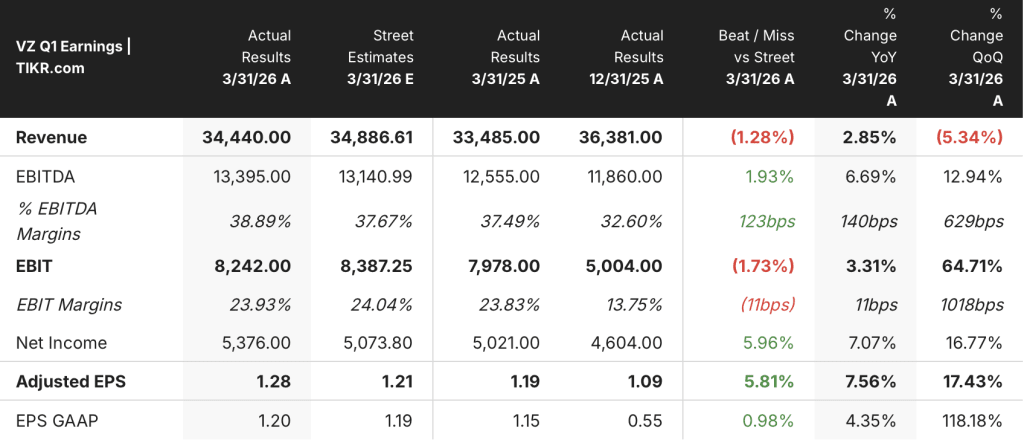
Verizon stock (VZ) delivered adjusted EPS of $1.28 in Q1 2026, up 7.6% year-over-year, the fastest growth rate in more than four years.
Total revenues reached $34.4B, up 2.9% YoY despite an 80-basis-point drag on wireless service revenue from customer credits tied to a network outage in January.
The mobility metrics were the quarter’s most consequential result: Verizon posted 55,000 postpaid phone net adds, the first positive Q1 total in 13 years and a 344,000 improvement versus Q1 2025.
Consumer postpaid phone churn fell to 90 basis points for the quarter, down 5 basis points sequentially from Q4 2025, and exited March below 85 basis points.
Cost of acquisition and retention fell approximately 35% relative to the end of Q4, according to CEO Dan Schulman on the Q1 2026 earnings call, a structural shift attributed to micro-segmentation and reduced reliance on free handset promotions.
Broadband added 341,000 net subscribers in Q1, including 214,000 fixed wireless access adds and 127,000 fiber adds, bringing the total broadband base to approximately 16.8 million.
Mobility and broadband service revenue of $22.9B grew 1.6% YoY, with wireless service revenue of $20.6B down approximately 1% YoY after the outage impact; management confirmed Q1 will be the low point of the year and reaffirmed full-year guidance of 2% to 3% growth.
Adjusted EBITDA of $13.4B expanded 6.7% YoY, with EBITDA margin reaching 38.9%, up 140 basis points, which CFO Tony Skiadas described on the Q1 2026 earnings call as the highest EBITDA performance in Verizon’s history.
Free cash flow was $3.8B for the quarter, up 4% YoY, after absorbing approximately $1.1B in severance payments tied to a 13,000-person workforce reduction.
Verizon completed $2.5B in share repurchases during Q1, the first buyback program in over a decade, and declared its 20th consecutive annual dividend increase at $0.07 per share (2.5% higher).
On guidance, management raised full-year adjusted EPS growth to 5% to 6% from the prior range of 4% to 5% and now expects postpaid phone net adds to land in the upper half of the 750,000 to 1 million range.
Verizon Stock Financials
The Q1 2026 income statement shows a company where cost discipline is outrunning a transitional revenue year, producing operating leverage even as service revenue faces short-term pressure.
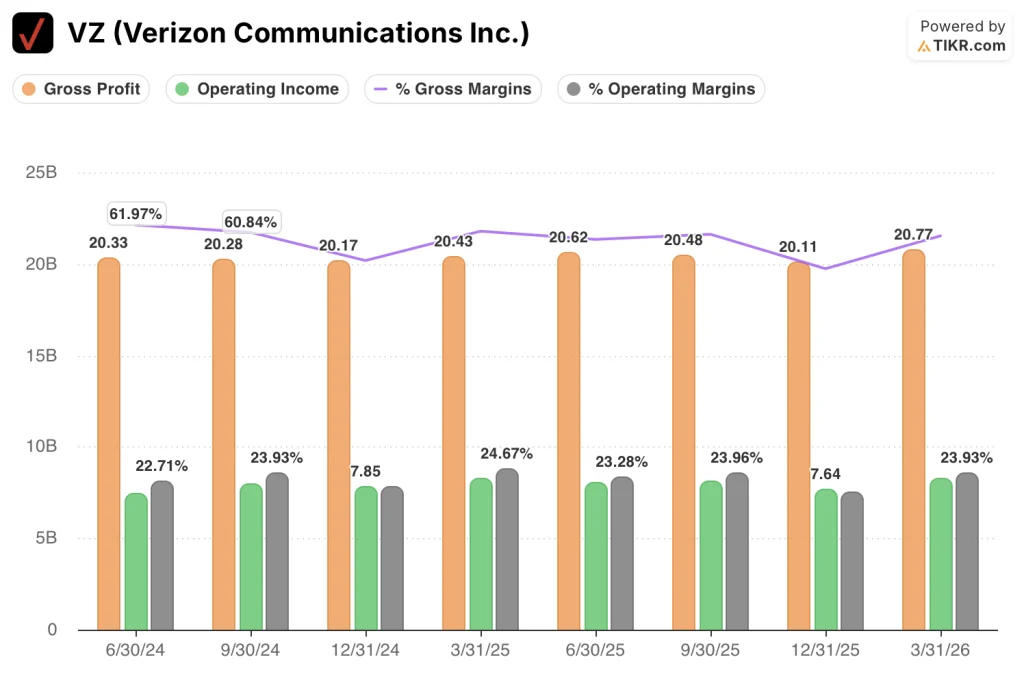
Gross margin expanded to 60.3% in Q1 2026, up from 55.3% in Q4 2025 and roughly in line with the 61.0% posted in Q1 2025, recovering after the Q4 trough driven by seasonal cost of goods patterns.
Gross profit reached $20.8B in Q1 2026, up from $20.4B in Q1 2025.
Operating income was $8.2B in Q1 2026, essentially flat year-over-year against the $8.3B posted in Q1 2025, but representing a sharp sequential recovery from the $7.6B posted in Q4 2025.
Operating margin was 23.9% in Q1 2026, up from 21.0% in Q4 2025 and roughly in line with the 24.7% peak posted in Q1 2025, which was the highest point in the trailing eight-quarter window.
The near-flat YoY operating income comparison reflects the incremental depreciation and interest expense absorbed from the Frontier acquisition, which added approximately $1.0B in interest expense and $1.5B in depreciation according to Skiadas on the Q1 2026 earnings call; the EBITDA line strips those out and shows the underlying operating leverage more cleanly.
Verizon Valuation Model Take
The TIKR model prices Verizon stock at $73.14 under its mid case, implying approximately 55% total return from the current price of ~$47 over roughly 4.7 years, with an annualized return of 9.9%.
The mid case assumes a revenue CAGR of 1.7%, a net income margin of 15.7%, and EPS growth of 4.9% through the end of 2030, a set of assumptions the Q1 result does not challenge.
The Q1 report modestly strengthens the risk/reward picture: the EPS raise, the churn improvement, the cost reduction velocity, and the postpaid net add milestone all reduce the near-term execution risk embedded in those assumptions.
The investment case for Verizon stock is incrementally stronger after this quarter, with the direction of travel on churn, unit economics, and free cash flow all moving in the right direction simultaneously.

The tension this report creates: Verizon stock is re-rating on operational momentum, but the core model still depends on whether cost savings compound into durable margin expansion or plateau as the Frontier integration headwinds normalize.
What Has to Go Right
- Consumer postpaid phone churn holds below 85 basis points into Q2 and drives net add momentum toward the upper half of the 750,000 to 1 million full-year target
- The $5B OpEx savings program for 2026 delivers on track, with cost of acquisition and retention remaining at reduced levels as micro-segmentation matures
- Mobility and broadband service revenue growth exits 2026 at the high end of the 2% to 3% guided range, confirming Q1 as the seasonal low point
- Frontier integration synergies ramp toward the $1B run-rate target by 2028, with 32 million fiber passings delivered by year-end 2026 supporting convergence penetration gains
What Could Still Go Wrong
- Wireless service revenue remains pressured beyond Q1 if promotional amortization headwinds from prior-year pricing actions prove stickier than the 180 basis points management flagged
- EBITDA margin improvement stalls once one-time cost savings from the 13,000-person workforce reduction are fully lapped, exposing the $1.0B in incremental Frontier interest expense
- Broadband net adds decelerate in the back half of 2026 as the easy early-Frontier cross-sell window closes and only 20% of the wireless base currently holds a broadband subscription
- Competitive intensity returns if peers respond to Verizon’s churn gains with renewed promotions, forcing CoA and CoR back toward prior-year levels and reversing the EPS tailwind
Should You Invest in Verizon Communications Inc.?
The only way to really know is to look at the numbers yourself. TIKR gives you free access to the same institutional-quality financial data that professional analysts use to answer exactly that question.
Pull up VZ stock and you’ll see years of historical financials, what Wall Street analysts expect for revenue and earnings in the quarters ahead, how valuation multiples have moved over time, and whether price targets are trending up or down.
You can build a free watchlist to track Verizon Communications Inc. alongside every other stock on your radar. No credit card required. Just the data you need to decide for yourself.
Access Professional Tools to Analyze VZ stock on TIKR for Free →