Few stocks have generated more debate about price than NVIDIA (NVDA) has over the past four years.
The NTM P/E sits at 24.97x today, with an LTM P/E of 42.50x based on trailing earnings. For a business that traded at cyclical lows in 2022 and then became the defining AI infrastructure stock of the decade, that premium reflects something the market has consistently believed about NVIDIA: that the demand cycle for its hardware has more room to run than skeptics expect.
Understanding what that multiple means today requires looking at the full history of the re-rating and what could alter it from here.
Now Live: Discover how much upside your favorite stocks could have using TIKR’s new Valuation Model (It’s free)>>>
NVIDIA’s Current P/E in Context

NVIDIA’s LTM P/E of 42.50x sits above most large-cap technology peers, though it represents meaningful compression from where the stock traded during the peak of AI enthusiasm in 2023. Net income margins have expanded dramatically, reaching approximately 56.9% over the past year, which is what makes a 42x multiple feel less extreme than it might otherwise appear.
One Year: The Multiple Has Quietly Compressed to a Near-Term Low
Over the past twelve months, NVIDIA’s LTM P/E ranged from a low of 33.71x to a high of 59.07x, with a mean of 47.18x. The current reading of 42.50x sits below that one-year average.

The multiple peaked near 59x in mid-2025 before compressing steadily through early 2026, with a sharp drop in late February that brought it briefly below 34x. The recovery since then has been driven primarily by earnings growth rather than by renewed multiple expansion, which is a healthier setup than the one that drove the 2023 peak.
Analyze NVIDIA stock on TIKR Free→
Three Years: The Extraordinary Peak and the Equally Extraordinary Compression
The three-year view stretches back to mid-2023, capturing NVIDIA’s most dramatic valuation moment. The LTM P/E hit a high of 247.91x before compressing to a low of 32.08x, with a mean of 77.78x over the period.

That 247x peak was not irrational exuberance in the traditional sense. Earnings were genuinely lagging the stock price as the AI buildout accelerated faster than the income statement could reflect. What followed was one of the most rapid earnings catch-ups in large-cap history, compressing the multiple even as the stock continued climbing.
The current reading of 42.50x is a fraction of that peak, but the business underneath it is fundamentally different from what it was in early 2023.
Five Years: Gaming Boom, Crypto Bust, and the AI Revolution
The five-year chart tells the complete story as the LTM P/E ranged from a low of 32.08x to a high of 247.91x, with a mean of 77.09x. No other large-cap stock has a five-year valuation chart that looks quite like this one.

The trough in mid-2022 reflected a business under genuine pressure from collapsing crypto demand and a slowdown in gaming. What followed was a fundamental transformation in the revenue mix toward data centers, which now entirely dominates the earnings profile.
The current multiple, well below the five-year mean, suggests the market has largely moved past the peak euphoria and is now pricing NVIDIA as a high-quality growth business rather than a momentum trade.
See what analysts think about NVIDIA stock right now (Free with TIKR) >>>
Ten Years: A Business the Market Has Always Been Willing to Pay Up For
The full ten-year view shows a low of 16.98x, a high of 247.91x, and a mean of 64.26x. The current reading of 42.50x sits meaningfully below that long-run average.
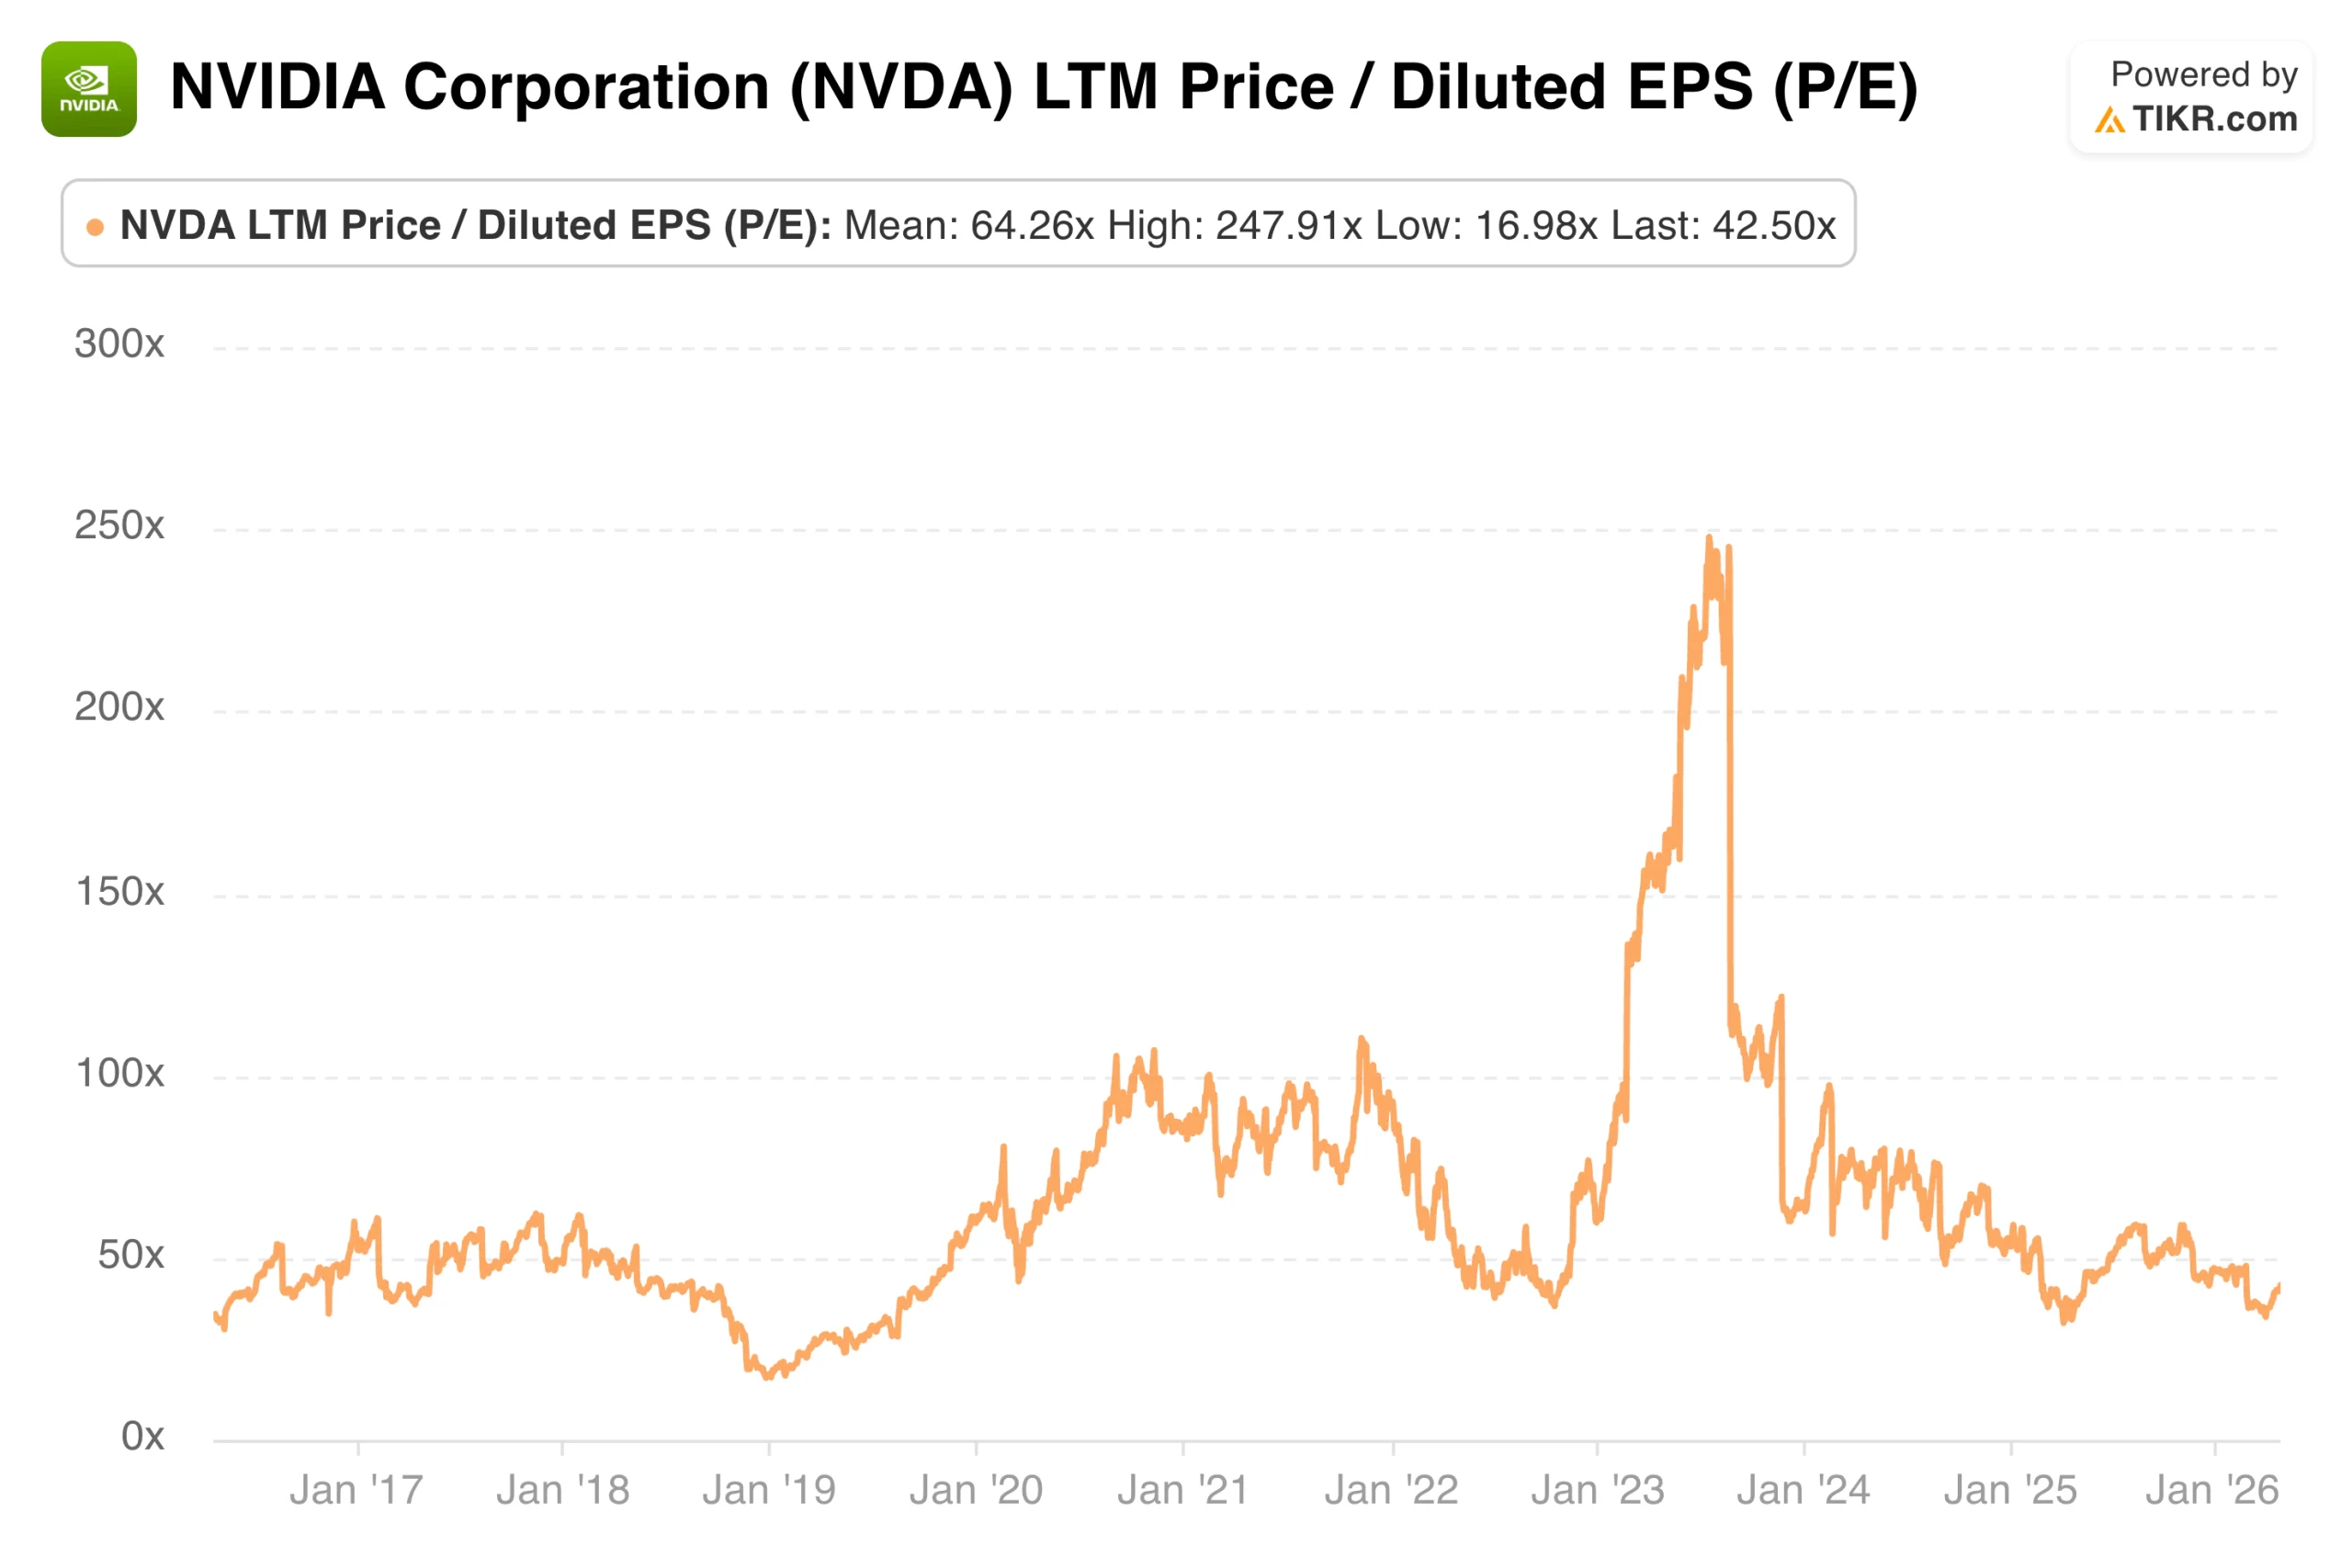
Even before the AI era, NVIDIA rarely traded cheaply. The market consistently assigned a premium to reflect the company’s positioning in high-performance computing and its track record of expanding into new markets.
The decade-long mean of 64.26x is a useful anchor: at 42.50x today, NVIDIA is trading below its own long-run average, which is not something said about many of the largest companies in the world.
See historical and forward estimates for NVIDIA stock (It’s free!) >>>
Bull Case, Bear Case, and What the Model Implies
The bull case does not require NVIDIA to grow at extraordinary rates forever. It requires the data center buildout to continue and hyperscaler capex to hold. If those conditions persist, earnings growth will absorb the current multiple, and the stock will compound steadily from here.
The bear case is that hardware multiples mean-revert. Enterprise spending cycles turn. Competitive pressure from AMD, custom silicon, and international vendors erodes pricing power over time. In that scenario, a P/E in the low 40s on decelerating earnings is a less comfortable place to be than it appears today.

The valuation model on TIKR, using mid-case assumptions of 19.9% revenue growth and 56.3% net income margins, points to a target price of $500.37 and a potential total return of 140.2% over the next 4.8 years, or approximately 20.1% annualized.
The model assumes modest P/E compression of roughly 1.1% annually, implying the return thesis depends on earnings growth rather than multiple expansion. At the current price, that is a compelling setup if the data center buildout continues on its current trajectory.
Build your own Valuation Model to value any stock (It’s free!) >>>
How Much Upside Does NVIDIA Stock Have From Here?
With TIKR’s new Valuation Model tool, you can estimate a stock’s potential share price in under a minute.
All it takes is three simple inputs:
- Revenue Growth
- Operating Margins
- Exit P/E Multiple
If you’re not sure what to enter, TIKR automatically fills in each input using analysts’ consensus estimates, giving you a quick, reliable starting point.
From there, TIKR calculates the potential share price and total returns under Bull, Base, and Bear scenarios so you can quickly see whether a stock looks undervalued or overvalued.
See a stock’s true value in under 60 seconds (Free with TIKR) >>>
Looking for New Opportunities?
- See what stocks billionaire investors are buying so you can follow the smart money.
- Analyze stocks in as little as 5 minutes with TIKR’s all-in-one, easy-to-use platform.
- The more rocks you overturn… the more opportunities you’ll uncover. Search 100K+ global stocks, global top investor holdings, and more with TIKR.
Disclaimer:
Please note that the articles on TIKR are not intended to serve as investment or financial advice from TIKR or our content team, nor are they recommendations to buy or sell any stocks. We create our content based on TIKR Terminal’s investment data and analysts’ estimates. Our analysis might not include recent company news or important updates. TIKR has no position in any stocks mentioned. Thank you for reading, and happy investing!