
Key Stats for QXO Stock
- Past-6-Month Performance: -15%
- 52-Week Range: $12 to $28
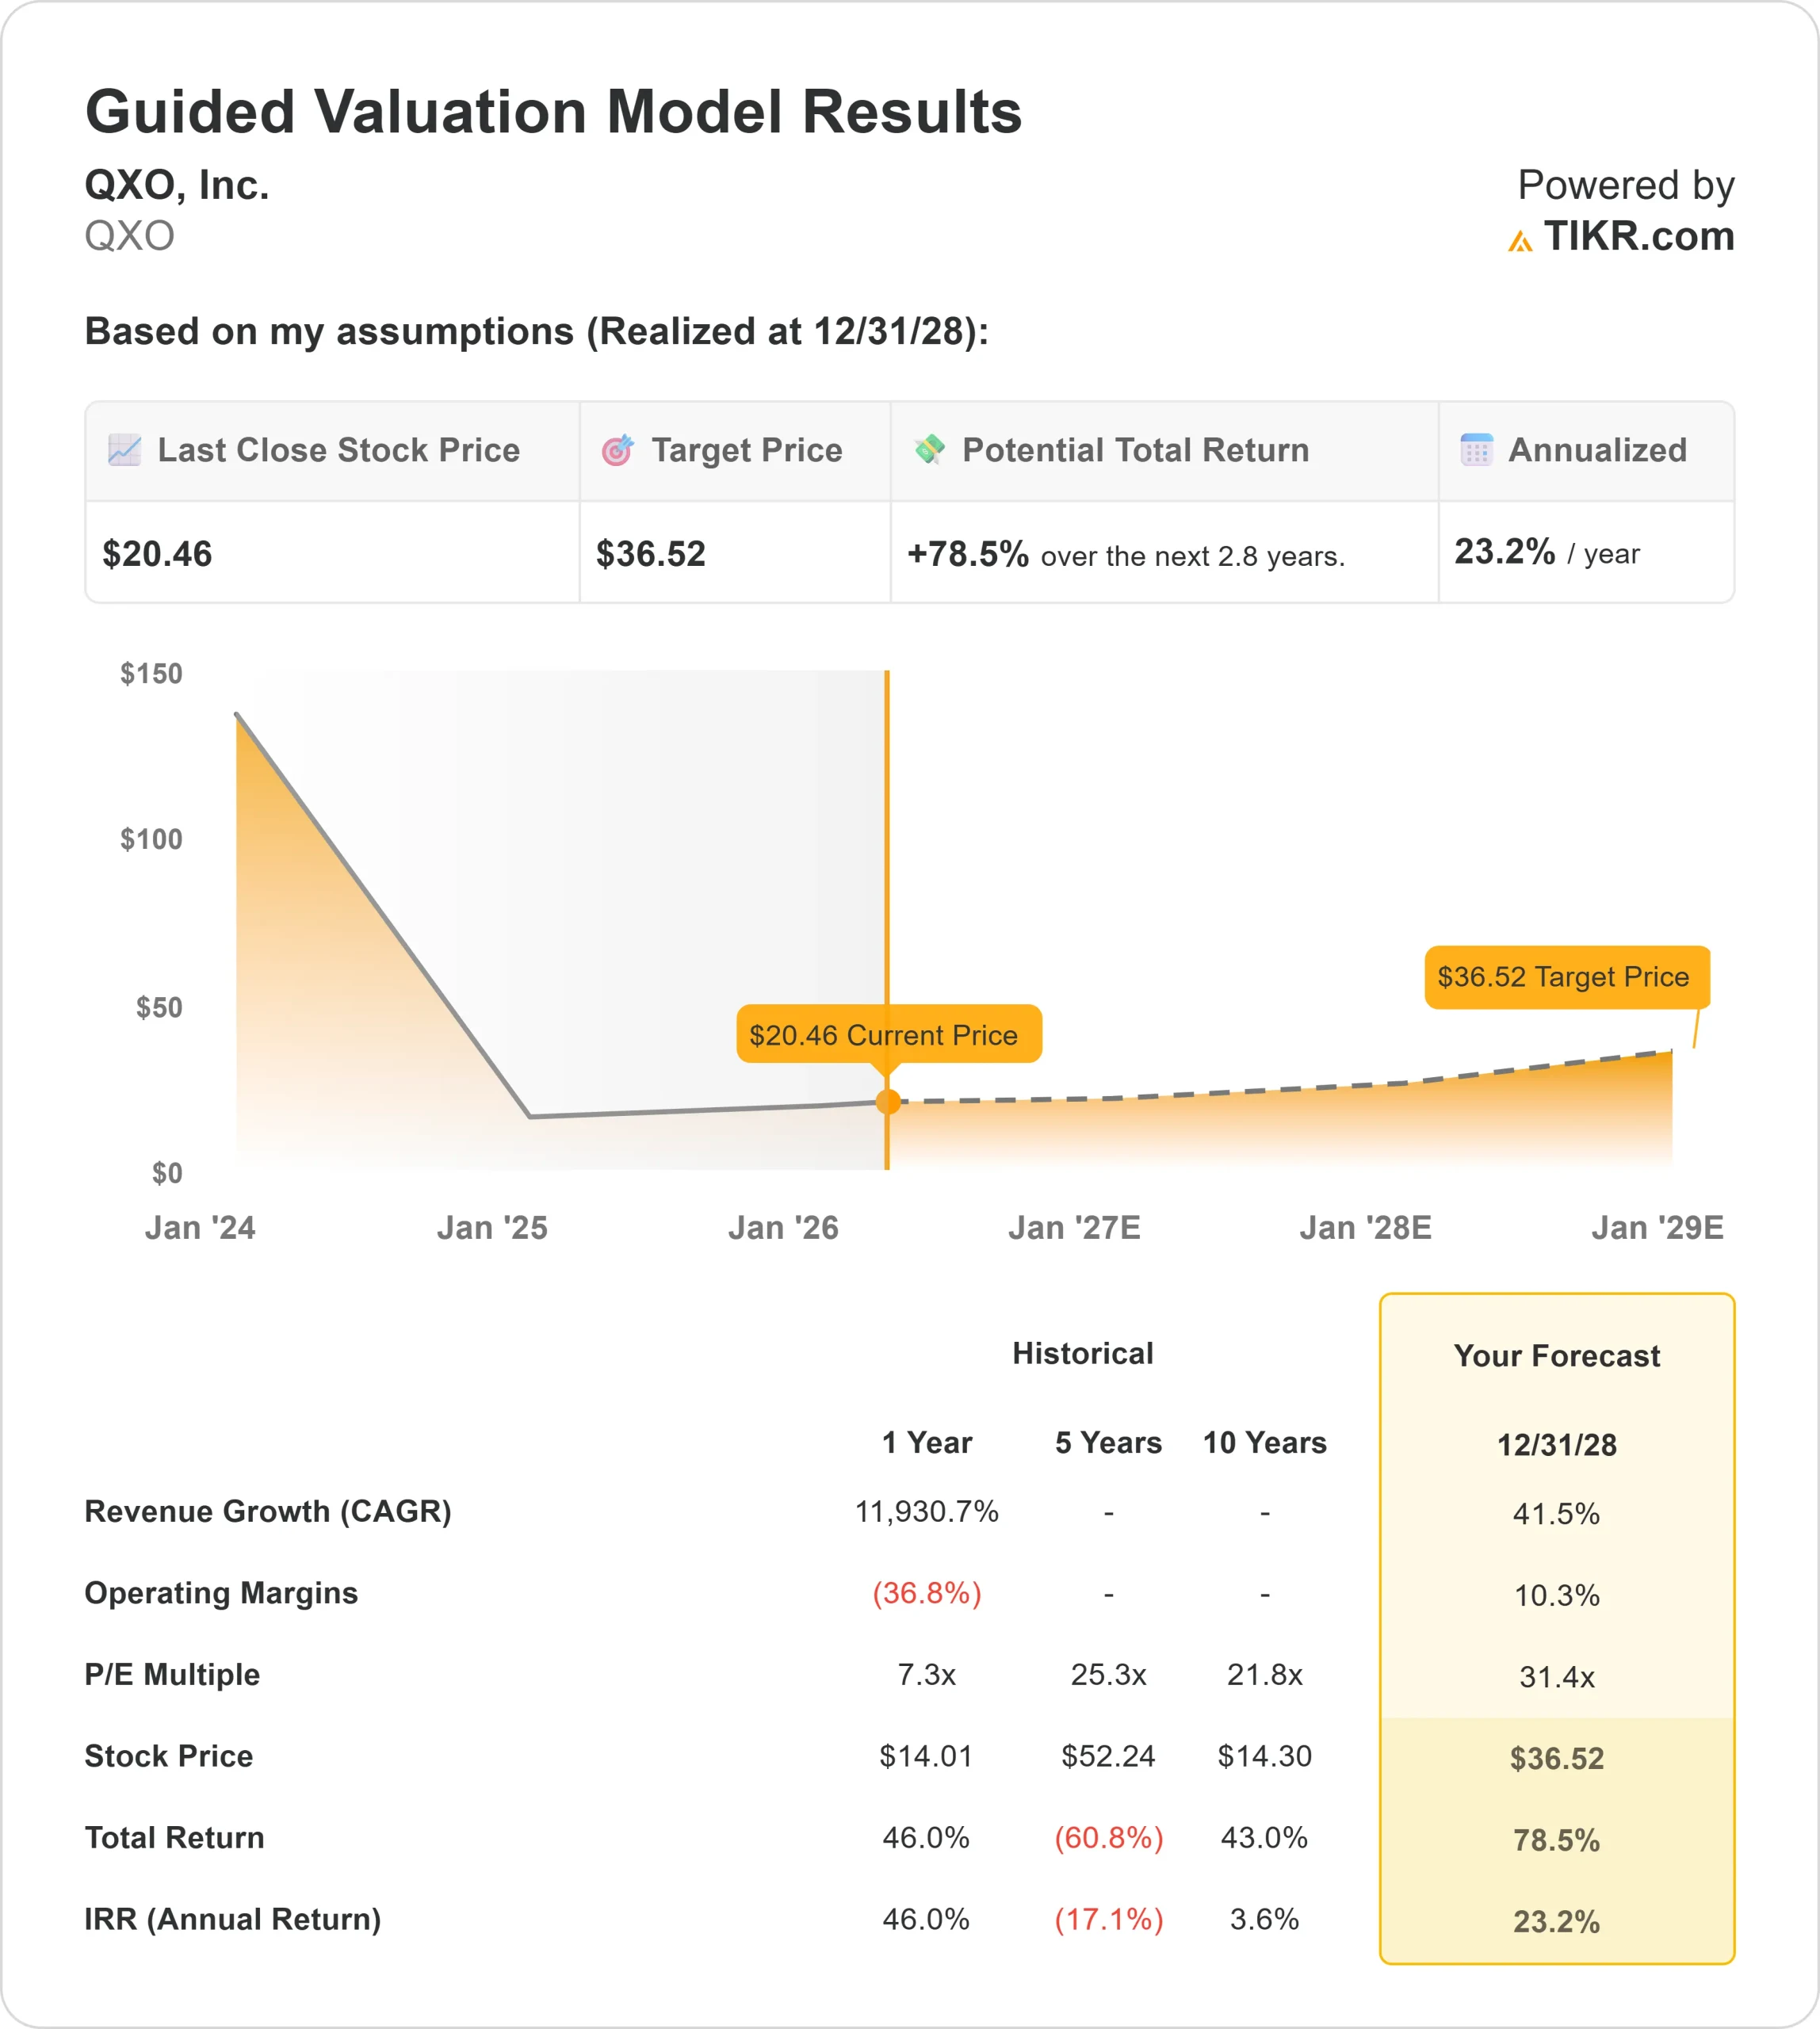
- Valuation Model Target Price: $37
- Implied Upside: 78.5%
Analyze your favorite stocks like QXO with TIKR (It’s free) >>>
What Happened?
QXO stock is down about 15% over the past 6 months, recently trading near $20 per share, as investors increasingly question whether the company’s aggressive acquisition-driven strategy can translate into meaningful profits, especially as the business scales rapidly but earnings remain weak.
The stock has declined primarily because QXO continues to operate with very low profitability while trading at elevated valuation levels, with LTM EBIT margins of about 1.1% and negative earnings raising concerns about how quickly the company can deliver margin expansion, particularly compared to more established building products distributors like Builders FirstSource and Beacon Roofing Supply, which generate significantly higher margins and more consistent cash flow.
Recent filings show mixed institutional positioning, which has added to volatility around the stock. MFN Partners reduced its stake by 18.5% to about 38.3 million shares worth $729 million, while Cantor Fitzgerald cut its position by 79.3% and Ghisallo Capital reduced its holdings by 80%, signaling profit-taking among some large holders.
At the same time, MTCO Ltd. acquired about 10.9 million shares valued at $208.5 million, Fred Alger Management purchased roughly 9.1 million shares worth $173 million, and Brevan Howard Capital Management disclosed a new position worth about $5 million, highlighting continued long-term interest, with overall institutional ownership remaining around 58.7%.
Additional pressure came from recent corporate developments, including a leadership transition after Chief Accounting Officer Sean Smith stepped down effective March 15, 2026, with Robert Loughran appointed interim CAO, alongside the company’s announcement of its May 5, 2026 annual shareholder meeting, contributing to uncertainty during a period of rapid expansion.
Value QXO instantly (Free with TIKR) >>>
Is QXO Undervalued?
Under valuation assumptions, the stock is modeled using:
- Revenue Growth (CAGR): 41.5%
- Operating Margins: 10.3%
- Exit P/E Multiple: 31.4x
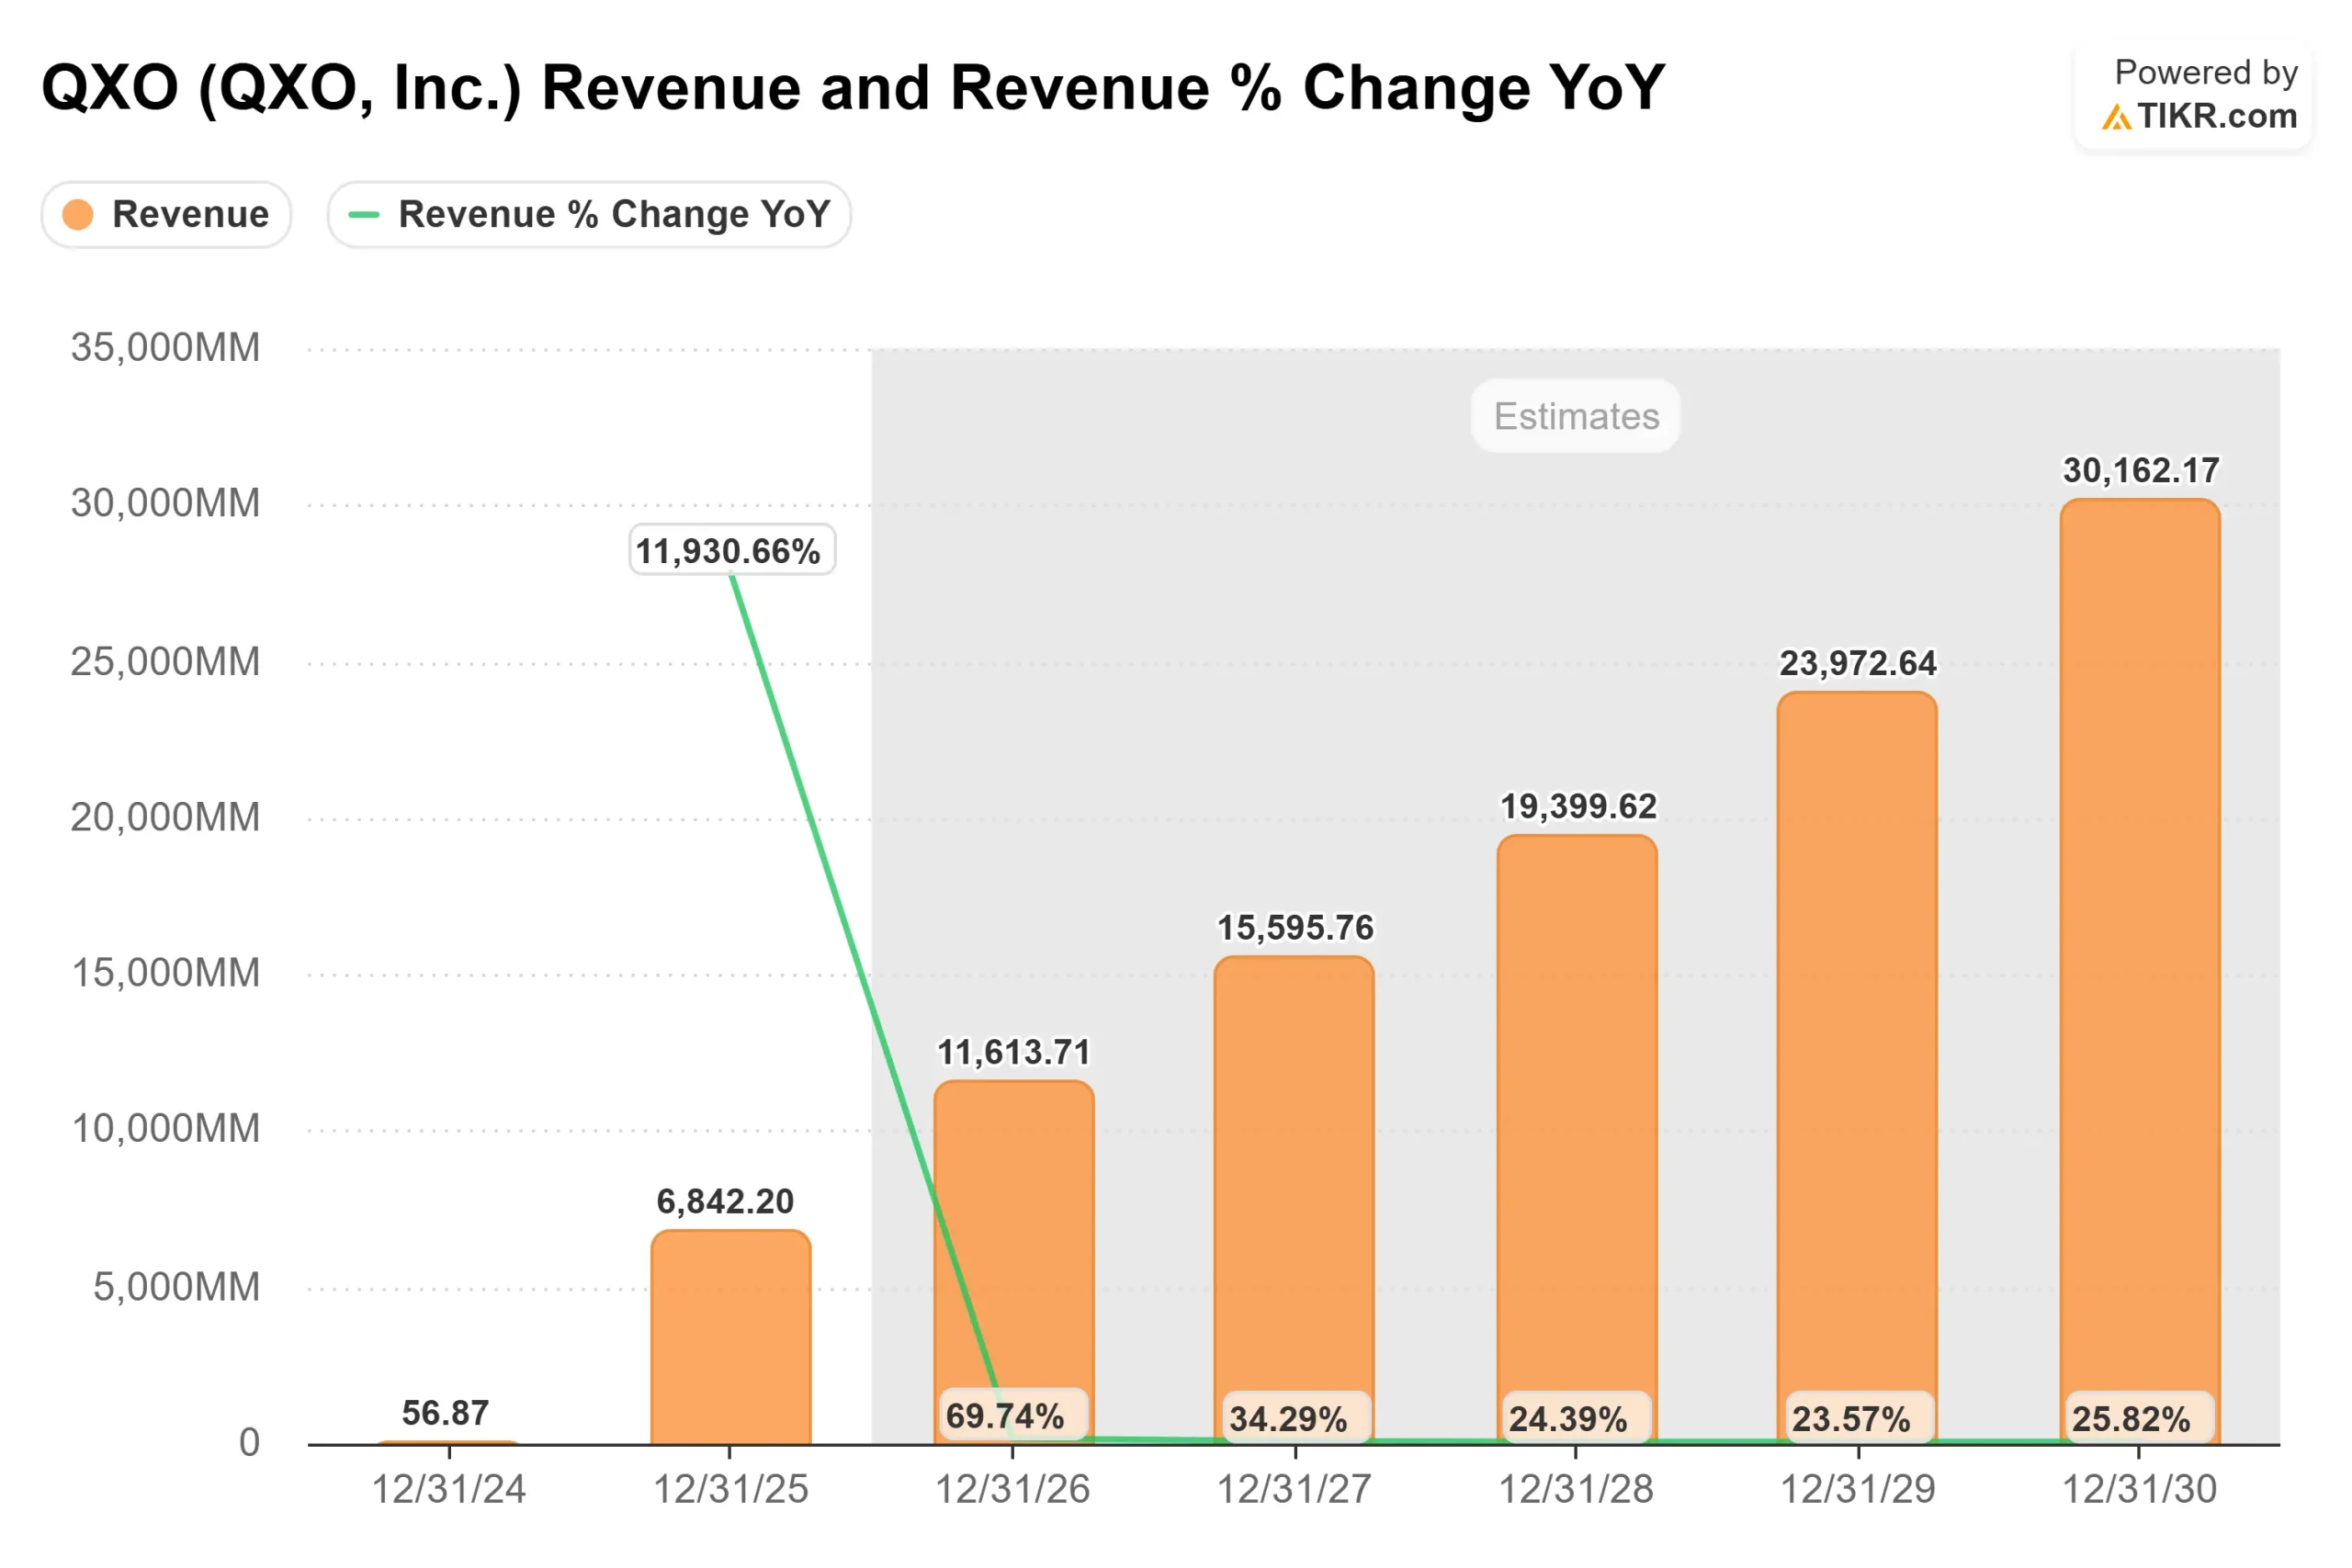
Revenue is expected to scale rapidly as QXO executes its roll-up strategy in building products distribution, where the company acquires smaller operators and integrates them to build scale in a fragmented industry, which can drive volume growth and improve pricing power over time.
See analysts’ growth forecasts and price targets for QXO (It’s free) >>>
Margin expansion remains the most important driver, as improving procurement efficiency, consolidating operations, and leveraging scale across acquisitions could move EBIT margins from roughly 1% today toward double-digit levels if execution is successful.
This highlights that future returns depend less on revenue growth alone and more on execution across integration, pricing discipline, and cost control, particularly as the company competes with more efficient peers that already operate at higher margins.
Based on these inputs, the model estimates a target price of $37, implying about 78.5% total upside over roughly 2.8 years, indicating the stock appears undervalued at current levels.
Execution over the next 12 months will likely be shaped by acquisition integration, margin improvement, and demand trends in construction and repair activity, which influence volumes and pricing across the business.
At current levels, QXO appears undervalued, with future performance driven by successful execution of its scale strategy and margin expansion rather than simply continued revenue growth.
How Much Upside Does QXO Stock Have From Here?
Investors can estimate QXO potential share price, or what any stock could be worth, in under a minute using TIKR’s New Valuation Model tool.
All it takes is three simple inputs:
- Revenue Growth
- Operating Margins
- Exit P/E Multiple
From there, TIKR calculates the potential share price and total returns under Bull, Base, and Bear scenarios so you can quickly see whether a stock looks undervalued or overvalued.
If you’re not sure what to enter, TIKR automatically fills in each input using analysts’ consensus estimates, giving you a quick, reliable starting point.