

Key Stats
- Current Price: $41 (May 12, 2026, +28.56%)
- Q1 2026 Revenue: $1.42B (+11% YoY)
- Q1 2026 Net Income: $80.7M (+$52.3M YoY)
- Q1 2026 Adjusted EBITDA: $170.4M (+75% YoY)
- Q1 2026 Diluted EPS: $0.50 (vs. $0.17 prior year)
- Full-Year 2026 Revenue Guidance: $5.65B to $5.75B (reaffirmed)
- Full-Year 2026 Adjusted EBITDA Guidance: $605M to $625M (raised $50M at all levels)
- TIKR Model Price Target (Mid): $34
- Implied Downside: (17%) over 5.6 years
PACS Group Stock Surges 29% After Q1 Earnings Beat: What the Numbers Actually Say
PACS Group stock (PACS) delivered $1.42B in Q1 2026 revenue, up 11% year-over-year, while adjusted EBITDA surged 75% to $170.4M.
Diluted EPS came in at $0.50, up from $0.17 in the prior-year quarter, according to Carey Hendrickson, Chief Financial Officer, on the Q1 earnings call.
The EBITDA result included approximately $16.3M of net benefit from California’s Workforce and Quality Incentive Program (WQIP), a performance-based state reimbursement program tied to quality outcomes and workforce investment.
Even excluding the WQIP benefit, adjusted EBITDA increased $57M year-over-year in the first quarter, according to Hendrickson on the Q1 earnings call.
The WQIP payment received in Q1 2026 was the last tied to the 2024 program year, with two additional payments from the 2025 program year still expected, though management excluded both from guidance due to timing and amount uncertainty.
Occupancy was a primary driver of the result, with total portfolio occupancy of 90.9% compared to 89.2% in the prior year, against an industry average of approximately 79%, according to Hendrickson on the Q1 earnings call.
Skilled mix improved to 30.5%, up 90 basis points year-over-year, driven primarily by continued progression within PACS Group’s ramping facility cohort.
Mature facilities operated at 94.8% occupancy with a skilled mix of 33%, while ramping facilities averaged 88.9% occupancy with skilled mix continuing to improve as they progress toward mature performance levels.
Cost of services totaled $1.07B, up 5% year-over-year, which against 11% revenue growth demonstrates the operating leverage embedded in the platform, according to Hendrickson on the Q1 earnings call.
Management raised full-year 2026 adjusted EBITDA guidance by $50M at all levels of the range, to $605M to $625M, representing approximately 22% growth over 2025 at the midpoint.
Full-year revenue guidance of $5.65B to $5.75B was reaffirmed despite removing approximately $120M of previously assumed acquisition revenue from the outlook, implying stronger organic performance than management originally expected at the start of the year.
The Board approved a $250M share repurchase authorization, providing an additional capital allocation tool with no fixed expiration date and no obligation to repurchase any specific amount.
PACS Group also deployed $86.5M in strategic real estate investments during the quarter, consistent with its long-term approach to increasing ownership within its operating footprint, while ending the quarter with approximately $800M of available liquidity and net leverage of just 0.1x.
The company disclosed 40 administrators currently enrolled in its Administrator-in-Training program, described by management as the highest number reported on earnings calls to date, reflecting preparation for continued acquisition activity.
At the end of Q1 2026, 222 facilities carried a 4- or 5-star CMS quality measure rating, up from 207 at the end of 2025.
Remediation of previously disclosed material weaknesses in internal controls over financial reporting remains ongoing, with management expecting substantial progress in 2026.
PACS Group Stock: What the Income Statement Shows
PACS Group stock’s income statement tells a clear margin expansion story, with operating leverage improving every quarter over the past year.
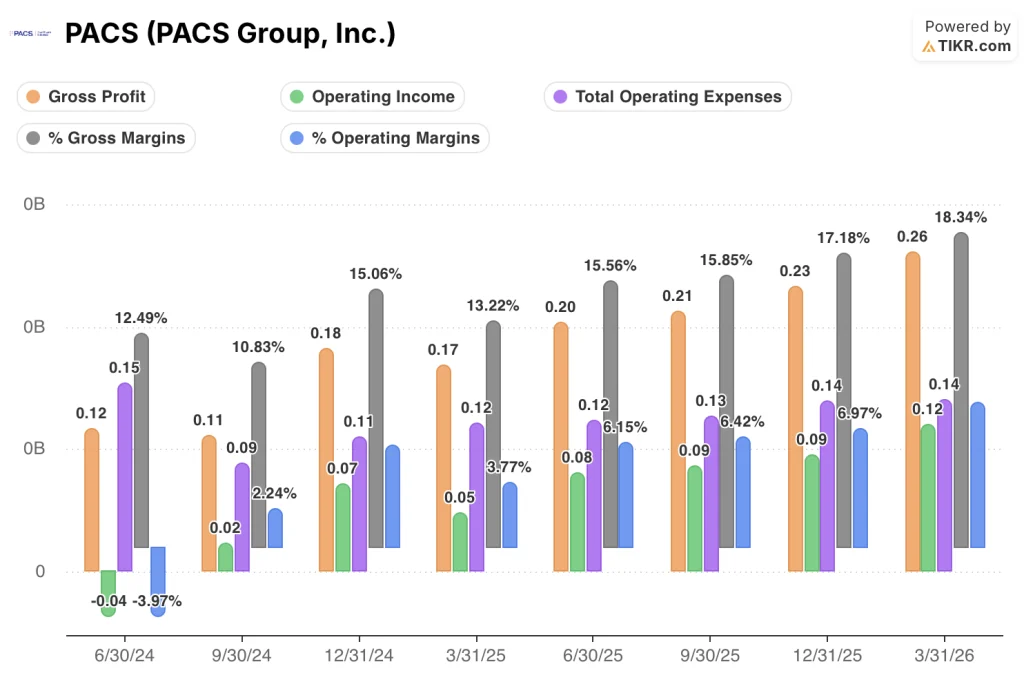
Gross margin expanded from 13.2% in Q1 2025 to 18.3% in Q1 2026, a 510-basis-point improvement over four quarters.
Gross profit grew from $170M in Q1 2025 to $260M in Q1 2026, up 54% year-over-year.
The sequential margin trend reinforces the story: gross margin moved from 15.6% in Q2 2025, to 15.8% in Q3 2025, to 17.2% in Q4 2025, and 18.3% in Q1 2026.
Operating income rose from $50M in Q1 2025 to $120M in Q1 2026, a 149% year-over-year increase.
Operating margin followed the same progression: 3.8% in Q1 2025, 6.1% in Q2 2025, 6.4% in Q3 2025, 7% in Q4 2025, and 8.5% in Q1 2026.
Total operating expenses increased approximately 5.8% year-over-year while revenue grew 11%, confirming the operating leverage thesis that management highlighted on the call.
PACS Group Stock: NTM P/E History
PACS Group stock is currently trading at 18.40x NTM earnings, well above its historical mean of 12.11x.
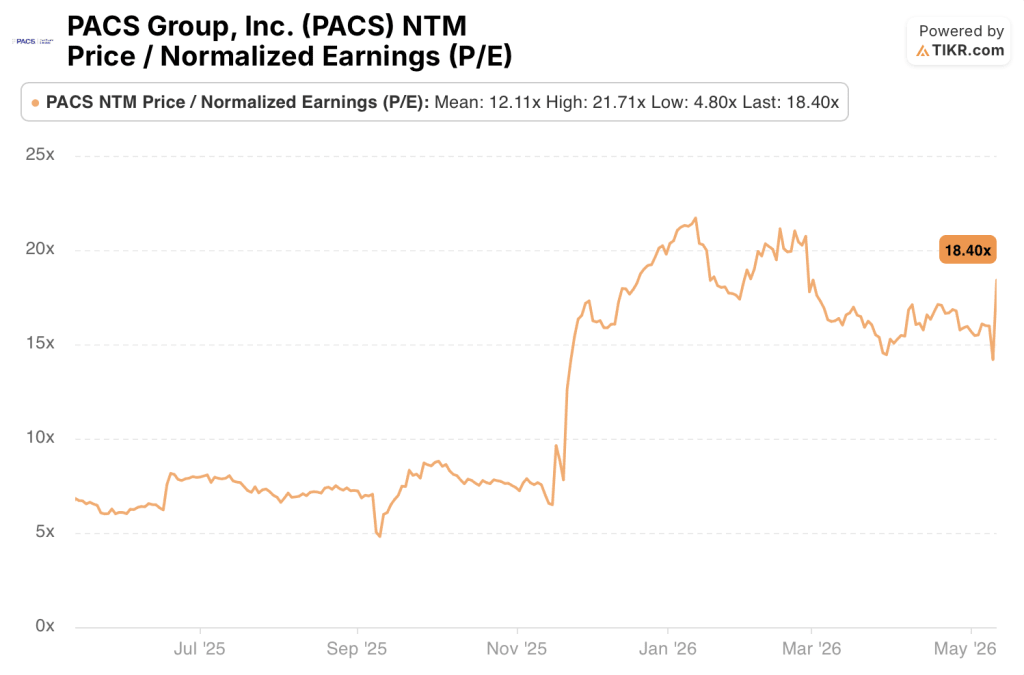
The multiple sat between 6x and 8x for most of 2025 before re-rating sharply in late 2025 as the platform’s operating leverage became visible in the income statement.
That re-rating is now embedded in the current price, which is precisely the source of compression the TIKR model assumes at (5.2%) per year.
At 18.40x against a mean of 12.11x, PACS Group stock is not cheap on a normalized basis, and the model’s compression assumption is directionally supported by the historical range.
What Does the Valuation Model Say?
The TIKR model prices PACS Group stock at $33.88 in the mid case, implying 17.4% downside from the current price of $41 over 5.6 years.
The mid-case model assumes a revenue CAGR of 7.7% from 2025 through 2035 and a net income margin of 5.6%, with P/E compression embedded at (5.2%) per year over the forecast period.
A 28% single-day move on strong Q1 earnings pulls the stock meaningfully above the mid-case target, which means the market is now pricing in either above-mid-case execution or a faster path to margin maturity than the model assumes.

The Q1 beat was genuine, but a 29% stock surge suggests that every forward assumption now has to clear a higher bar.
What Has to Go Right
- Same-store revenue growth of 8% year-over-year on 284 facilities signals that organic performance, not acquisition volume, is the primary engine, and management reaffirmed full-year revenue guidance of $5.65B to $5.75B after removing $120M of acquisition revenue from the outlook
- Ramping facilities spanning 7 new states from the 2024 expansion are still progressing toward mature occupancy and skilled mix levels, representing a structural source of earnings growth that does not require additional M&A
- Skilled mix at mature facilities sits at 33%, and management has demonstrated the ability to renegotiate hundreds of managed care contracts at higher rates, suggesting further revenue per patient day improvement is achievable as the ramping cohort matures
- The WQIP program has produced $16.3M in incremental EBITDA in Q1 alone, with two additional 2025 program year payments still expected, and management is actively advocating for a successor California quality program
What Could Still Go Wrong
- The TIKR model’s mid-case assumes only 5.6% net income margin at maturity, and P/E compression of (5.2%) per year is baked in, which means even solid execution produces negative annualized returns from current price levels
- Material weaknesses in internal controls over financial reporting remain unremediated, introducing ongoing risk around the reliability of reported figures at a company managing 323 facilities across 17 states
- Government investigations disclosed in prior quarters are still active, with management unable to estimate timing of resolution, and a negative outcome could materially affect the financial profile the Q1 results project
- Cost of services at $1.07B already consumes 75% of revenue, and any labor cost acceleration in California or other high-density markets could pressure the margin expansion trajectory that the current valuation requires
Even the high-case scenario, assuming 8.5% revenue CAGR and a 5.8% net income margin, reaches only $56, delivering 36% total return over the full forecast horizon.
At $41, PACS Group stock offers a negative annualized return of 4% per year in the mid case, which makes the current entry point more of a bet on the high scenario than a straightforward risk/reward proposition.
Should You Invest in PACS Group, Inc.?
The only way to really know is to look at the numbers yourself. TIKR gives you free access to the same institutional-quality financial data that professional analysts use to answer exactly that question.
Pull up PACS Group, Inc. stock and you’ll see years of historical financials, what Wall Street analysts expect for revenue and earnings in the quarters ahead, how valuation multiples have moved over time, and whether price targets are trending up or down.
You can build a free watchlist to track PACS Group, Inc. alongside every other stock on your radar. No credit card required. Just the data you need to decide for yourself.
Access Professional Tools to Analyze PACS stock on TIKR for Free →


