
Key Takeaways
- Demand is converting: Oracle’s Q1 revenue rose 30% year over year to $19.3 billion, while OCI revenue grew 121% to $7.4 billion.
- The backlog offers visibility: RPO increased $26 billion to $664 billion, with roughly half expected to convert into sales over the next 36 months.
- Cash is moving in both directions: Q1 operating cash flow reached $23.10 billion, but capital expenditure rose to $28.50 billion, leaving free cash flow at negative $5.40 billion.
- Margins need watching: Quarterly gross margin fell to 60.03%, its lowest level in the supplied eight-quarter history, as AI infrastructure became a larger part of Oracle’s mix.
Track Oracle’s earnings, RPO conversion, and cash-flow trend on TIKR for free →
Oracle’s AI Demand Is Becoming Revenue
Oracle (ORCL) has moved beyond selling investors a future AI opportunity. Its fiscal Q1 2027 results showed that delivered capacity is becoming reported revenue. Total revenue rose 30% year over year to $19.3 billion, while OCI revenue jumped 121% to $7.4 billion. The company also said it brought 850 megawatts of AI capacity online during the quarter, helping OCI maintain 97.9% GPU utilization.
The visibility argument is similarly stronger. Remaining performance obligations, or RPO, rose $26 billion in the quarter to $664 billion, and management now expects around half of that balance to convert into sales over the next 36 months. Oracle said most new contracts were structured through customer prepayments, bring-your-own-hardware arrangements, or similar mechanisms that should not require additional Oracle cash upfront.
That is a meaningful improvement from a pure backlog narrative. Q1’s growth indicates that Oracle can deploy capacity and recognize revenue against committed demand. Capacity that came up for renewal was renewed or resold at a 20% premium, according to the company’s Q1 earnings call. Yet the central investment question has not disappeared. It has become more specific: can this surge in demand produce durable cash flow before the infrastructure bill grows again?
Operating Cash Flow Is Surging, but CapEx Is Still One Step Ahead
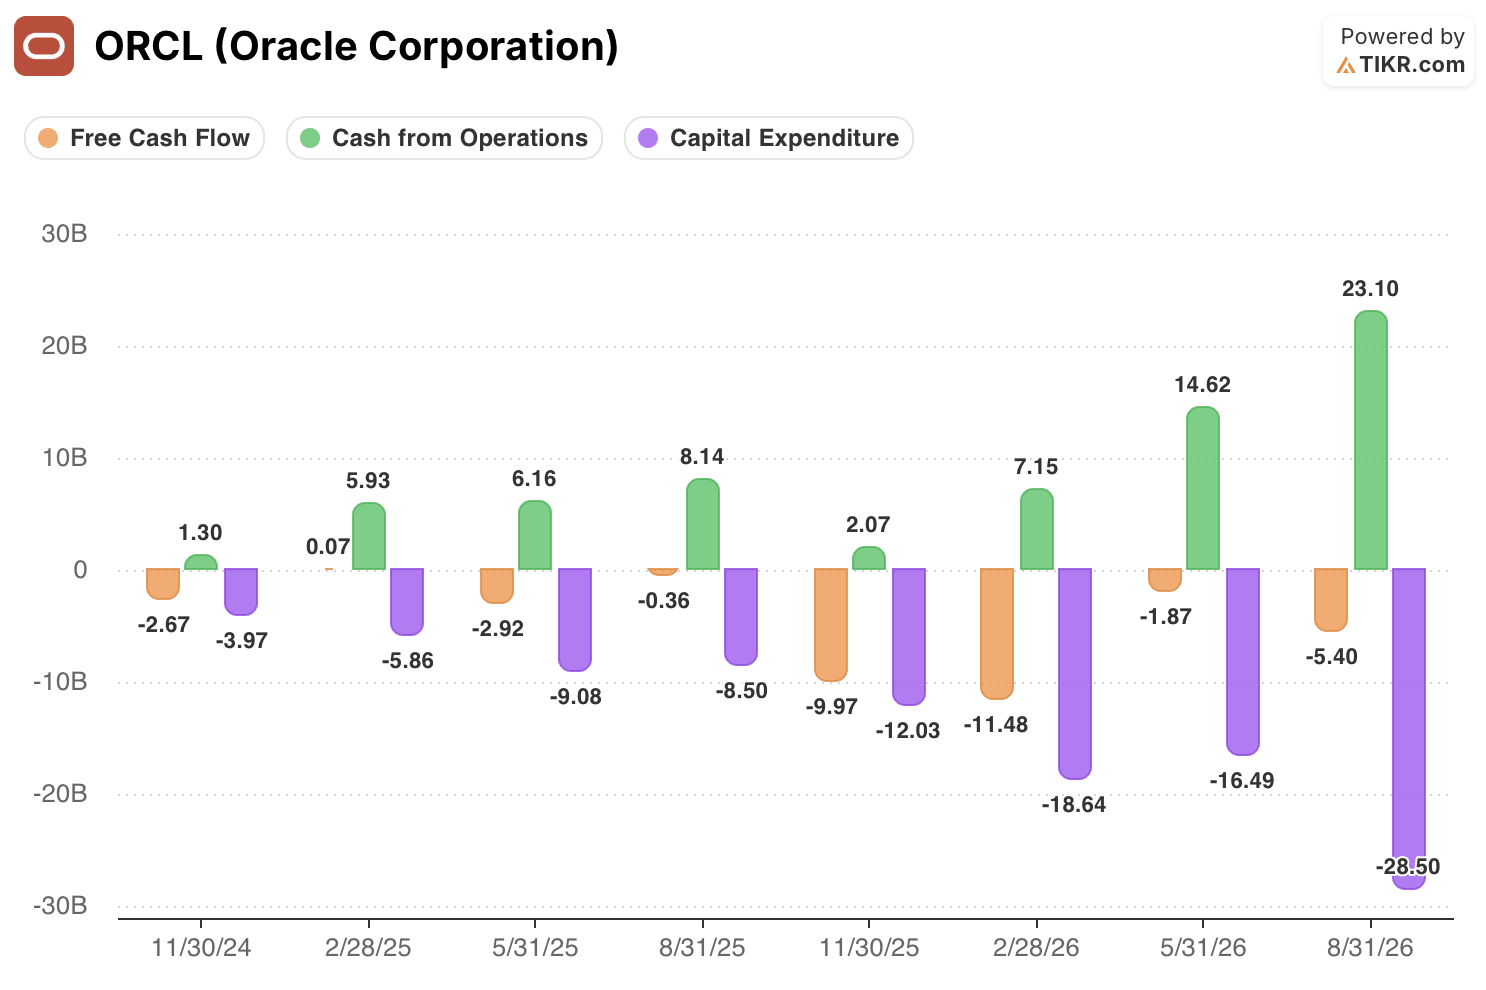
The latest quarterly cash-flow data captures Oracle’s challenge cleanly. Cash from operations climbed to $23.10 billion in the quarter ended August 31, 2026, from $14.62 billion in the preceding quarter and $8.14 billion a year earlier. That is a major improvement in operating inflows, helped by strong demand and customer prepayments.
But capital expenditure rose even more sharply to $28.50 billion, versus $16.49 billion in the prior quarter and $8.50 billion a year ago. Free cash flow was therefore negative $5.40 billion. The deficit was much narrower than the negative $11.48 billion recorded in the February 2026 quarter, but it shows that a strong cash-from-operations number is not the same as self-funded growth.
The pattern also explains why one quarter should not settle the debate. Oracle produced positive free cash flow of $0.07 billion in the February 2025 quarter, then recorded negative free cash flow in each of the following six displayed quarters. The figures are volatile because infrastructure deployment and customer funding do not arrive evenly. Investors should focus less on whether any individual quarter is positive and more on whether cash from operations can consistently close the gap with CapEx as OCI revenue scales.
Customer Funding Reduces the Strain, Not the Economic Risk
Oracle’s financing arrangements matter because they can change the timing of cash outflows. Customer prepayments and bring-your-own-hardware contracts mean the company may not have to fund every GPU and server purchase with its own balance sheet before revenue begins. Supplier arrangements can serve a similar purpose.
Still, management made an important clarification in the Q&A: capital is required for these projects even when the capital does not all come from Oracle. That means the model is not a shortcut around the economics of data-center construction. It is a way to share or defer some funding responsibility.
That distinction matters for Oracle stock. If customers remain willing to prepay, capacity stays highly utilized, and renewal pricing holds, the model could support a faster route to cash conversion than investors expect. If deployment takes longer, prepayments slow, or Oracle needs to keep funding new sites to preserve growth, free cash flow could remain negative despite an expanding backlog.
Management still expects $90 billion to $95 billion of total CapEx in fiscal 2027, capped at $70 billion on a net-cash basis after alternative financing. It also has not provided a specific date for positive free cash flow. The operating case is compelling, but the cash-flow case remains a forecast that needs to be verified quarter by quarter.
Compare Oracle’s quarterly operating cash flow with capital spending on TIKR for free →
Gross Margin Is Showing the Cost of the OCI Mix Shift
The supplied quarterly margin chart makes the tradeoff visible.
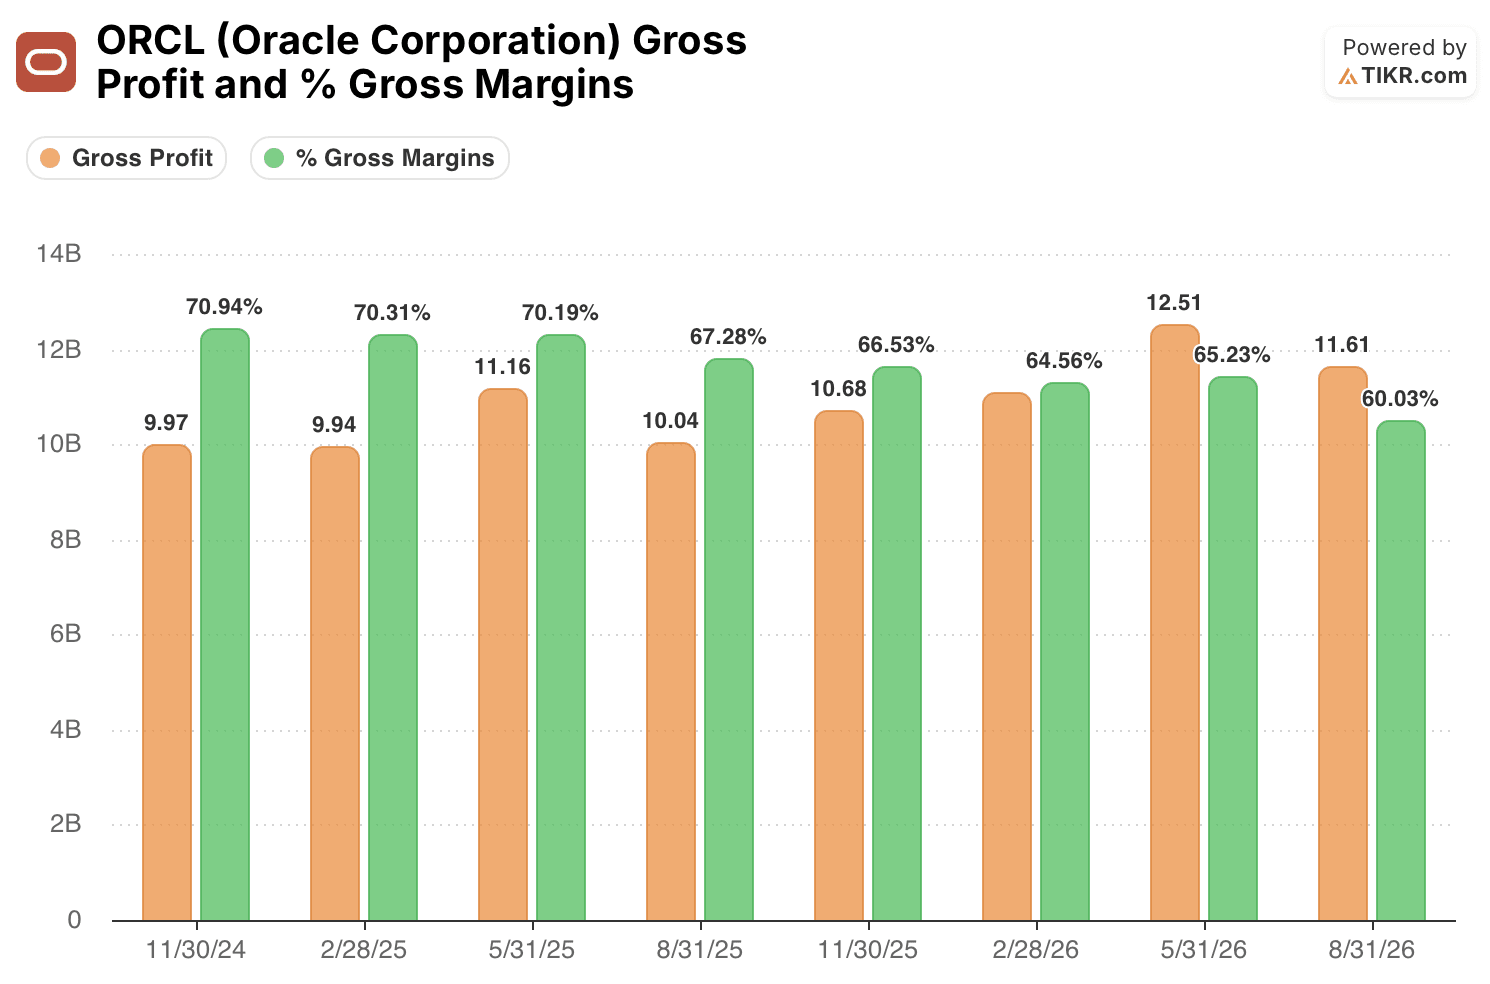
Oracle’s gross margin was 70.94% in the November 2024 quarter. It held near 70% through May 2025, then fell to 67.28% in August 2025, 66.53% in November, and 64.56% in February 2026. It recovered modestly to 65.23% in May before dropping to 60.03% in the latest quarter.
That is a 10.91-percentage-point decline from the year-ago quarter. Gross profit still increased to $11.61 billion from $10.04 billion a year earlier, which reflects the scale of Oracle’s revenue growth. But the margin trajectory confirms that a greater proportion of sales is now coming from capital-intensive cloud infrastructure rather than Oracle’s historically high-margin software business.
Management had already flagged that gross margin would step down as data centers ramp, while arguing that operating margin is the more important measure of value creation. That can be true if OCI’s higher revenue growth and lower selling and research costs relative to revenue offset the gross-margin pressure. The next few quarters must show that operating leverage is genuinely doing this work. A declining gross margin alone does not invalidate the AI thesis, but it raises the level of cash-flow and operating-profit evidence Oracle needs to provide.
Oracle’s Lower P/E Prices in Progress, Not Proof
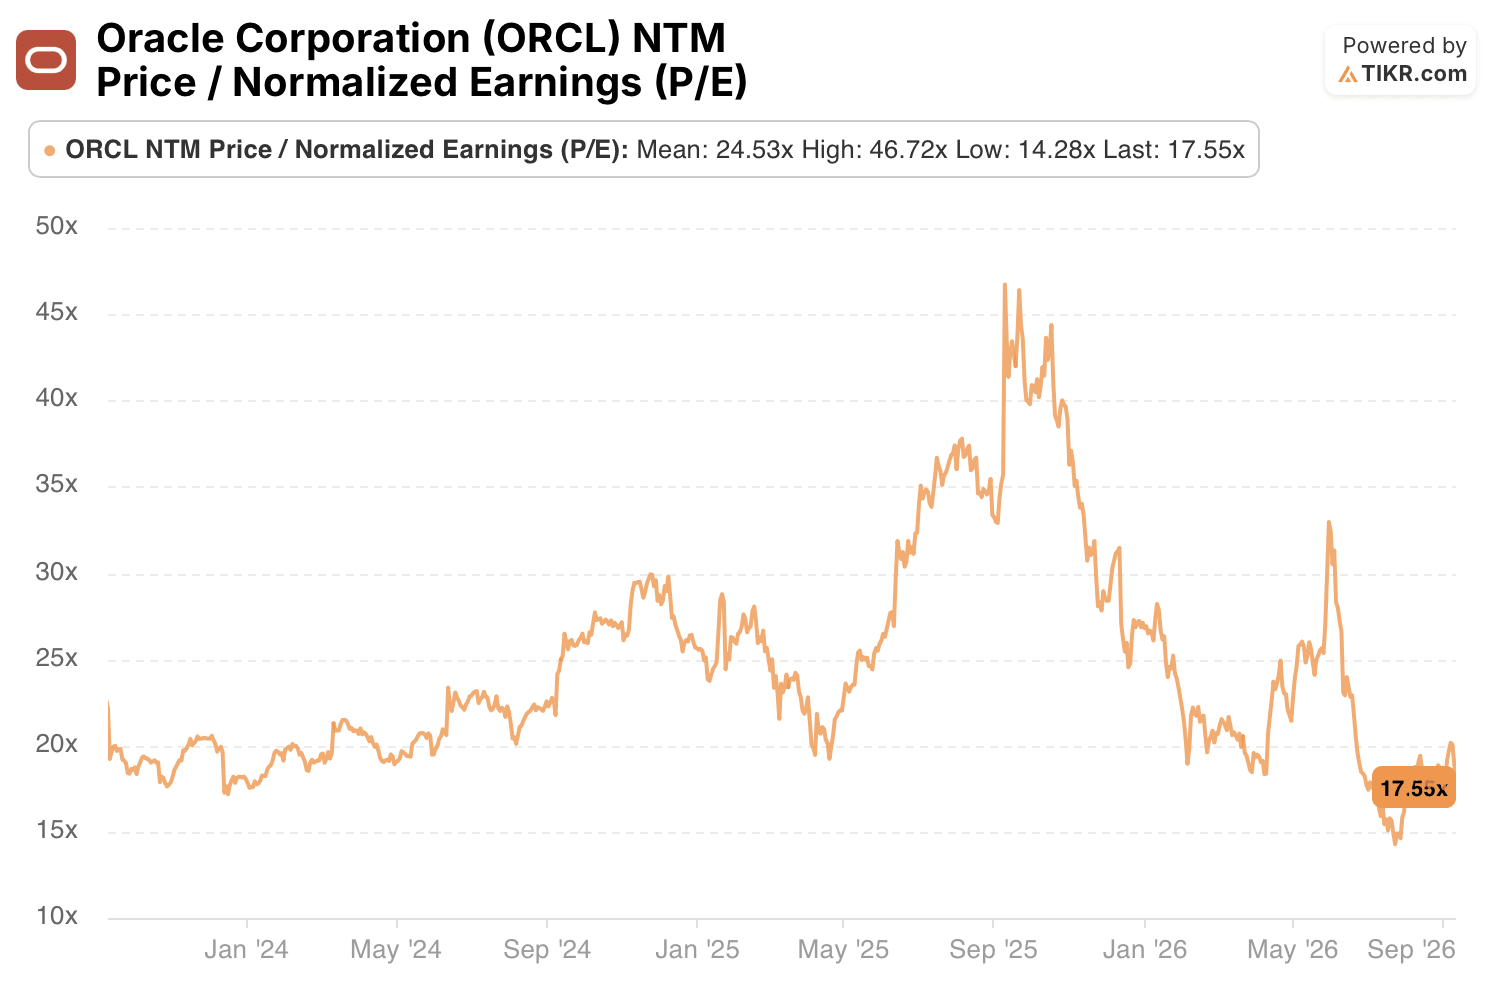
Oracle’s NTM price-to-normalized-earnings ratio was 17.55x in September 2026. That sits below the 24.53x average and well below the 46.72x high in the supplied TIKR history, though it remains above the 14.28x low. The lower multiple gives investors less reason to assume that every optimistic AI outcome is already priced into Oracle stock.
It is not, however, a valuation verdict. The denominator is forward normalized earnings, which depends on the same questions now facing the business: the pace at which RPO becomes revenue, the cost of adding capacity, and whether gross-margin pressure can be offset below the gross-profit line. A lower P/E does not compensate for a cash-flow recovery that fails to arrive.
The best case is becoming easier to see. OCI demand is real, backlog conversion has begun, and customer funding can ease the immediate cash burden. The unresolved risk is whether Oracle can make the new infrastructure base sufficiently productive before the next round of investment arrives. For shareholders, the next evidence is clear: sustained growth in operating cash flow, stabilizing gross margin, and a smaller gap between CapEx and operating inflows. If those measures improve together, the AI buildout will look like a cash-flow bridge. If not, Oracle’s backlog will remain impressive but financially incomplete.
Follow Oracle’s margins, estimates, and valuation history on TIKR for free →
Should You Invest in Oracle Corporation?
The only way to really know is to look at the numbers yourself. TIKR gives you free access to the same institutional-quality financial data that professional analysts use to answer exactly that question.
Pull up ORCL stock and you’ll see years of historical financials, what Wall Street analysts expect for revenue and earnings in the quarters ahead, how valuation multiples have moved over time, and whether price targets are trending up or down.
You can build a free watchlist to track ORCL alongside every other stock on your radar. No credit card required. Just the data you need to decide for yourself.
Access Professional Tools to Analyze ORCL stock on TIKR for Free →
Looking for New Opportunities?
- See what stocks billionaire investors are buying so you can follow the smart money.
- Analyze stocks in as little as 5 minutes with TIKR’s all-in-one, easy-to-use platform.
- The more rocks you overturn… the more opportunities you’ll uncover. Search 100K+ global stocks, global top investor holdings, and more with TIKR.
Disclaimer:
Please note that the articles on TIKR are not intended to serve as investment or financial advice from TIKR or our content team, nor are they recommendations to buy or sell any stocks. We create our content based on TIKR Terminal’s investment data and analysts’ estimates. Our analysis might not include recent company news or important updates. TIKR has no position in any stocks mentioned. Thank you for reading, and happy investing!