Key Stats for Moody’s Corporation Stock
- 52-Week Range: $402 to $547
- Current Price: $471.50
- Street Mean Target: $556
- NTM P/E: 26.5x
- LTM Gross Margin: 75%
- LTM Free Cash Flow: $1.53 billion (first half 2026)
- Market Cap: $81.7 billion
Moody’s stock just delivered a quarter that beat every line on the earnings table and still got a guide raise that sounded almost cautious. Find out what that combination means on TIKR for free
What the Market Got Wrong About Moody’s in 2026
For much of this year, investors have been wrestling with a simple question: is a company this tied to debt market activity really worth owning at 26 times forward earnings when corporate borrowing could slow at any moment?
That skepticism has kept Moody’s Corporation (MCO) stock down roughly 5.5% year-to-date even as the broader market has moved higher.
The Q2 results, reported July 22, made that caution look misplaced. Moody’s posted $2.185 billion in revenue, up 15% year-over-year, driven by a significant tailwind from surging debt issuance across virtually every category.
As the revenue chart below shows, quarterly revenue has been climbing steadily, and while consensus expects some seasonal softness in the back half of 2026, the trajectory heading into 2027 remains positive.

CEO Rob Fauber noted that customers are turning to Moody’s “to make consequential decisions with greater confidence” as capital markets grow more complex.
Leveraged loan issuance volume jumped 53%, investment-grade volume rose 17%, and the Public, Project and Infrastructure Finance segment saw rated issuance volume grow 44%, driven by data center and technology infrastructure financing.
The market had been pricing in a cyclical slowdown. Instead, Moody’s delivered the opposite.
Moody’s stock now carries a guide built on a stronger, if less revenue-dense, issuance mix heading into the back half. See how that mix shift shows up in the model on TIKR for free →
Two Very Different Businesses, Both Firing at Once
Moody’s runs two distinct segments, and understanding both matters for evaluating the stock.
Moody’s Investors Service, or MIS, is the legacy credit ratings business. When a company or government wants to issue bonds, they hire Moody’s to assign a credit rating, and MIS collects a fee.
In Q2, MIS revenue reached $1.26 billion, up 25% from the prior year, with an adjusted operating margin of 68.3%. Moody’s Analytics, or MA, is the newer software and data business, providing risk management tools, compliance products, and Know Your Customer solutions to financial institutions and corporations.
Unlike MIS, MA revenue is almost entirely recurring, with 99% of Q2 revenue coming from subscriptions and maintenance contracts.
The EPS chart below captures how the combined earnings power of both segments has trended, and what analysts expect as the business scales.
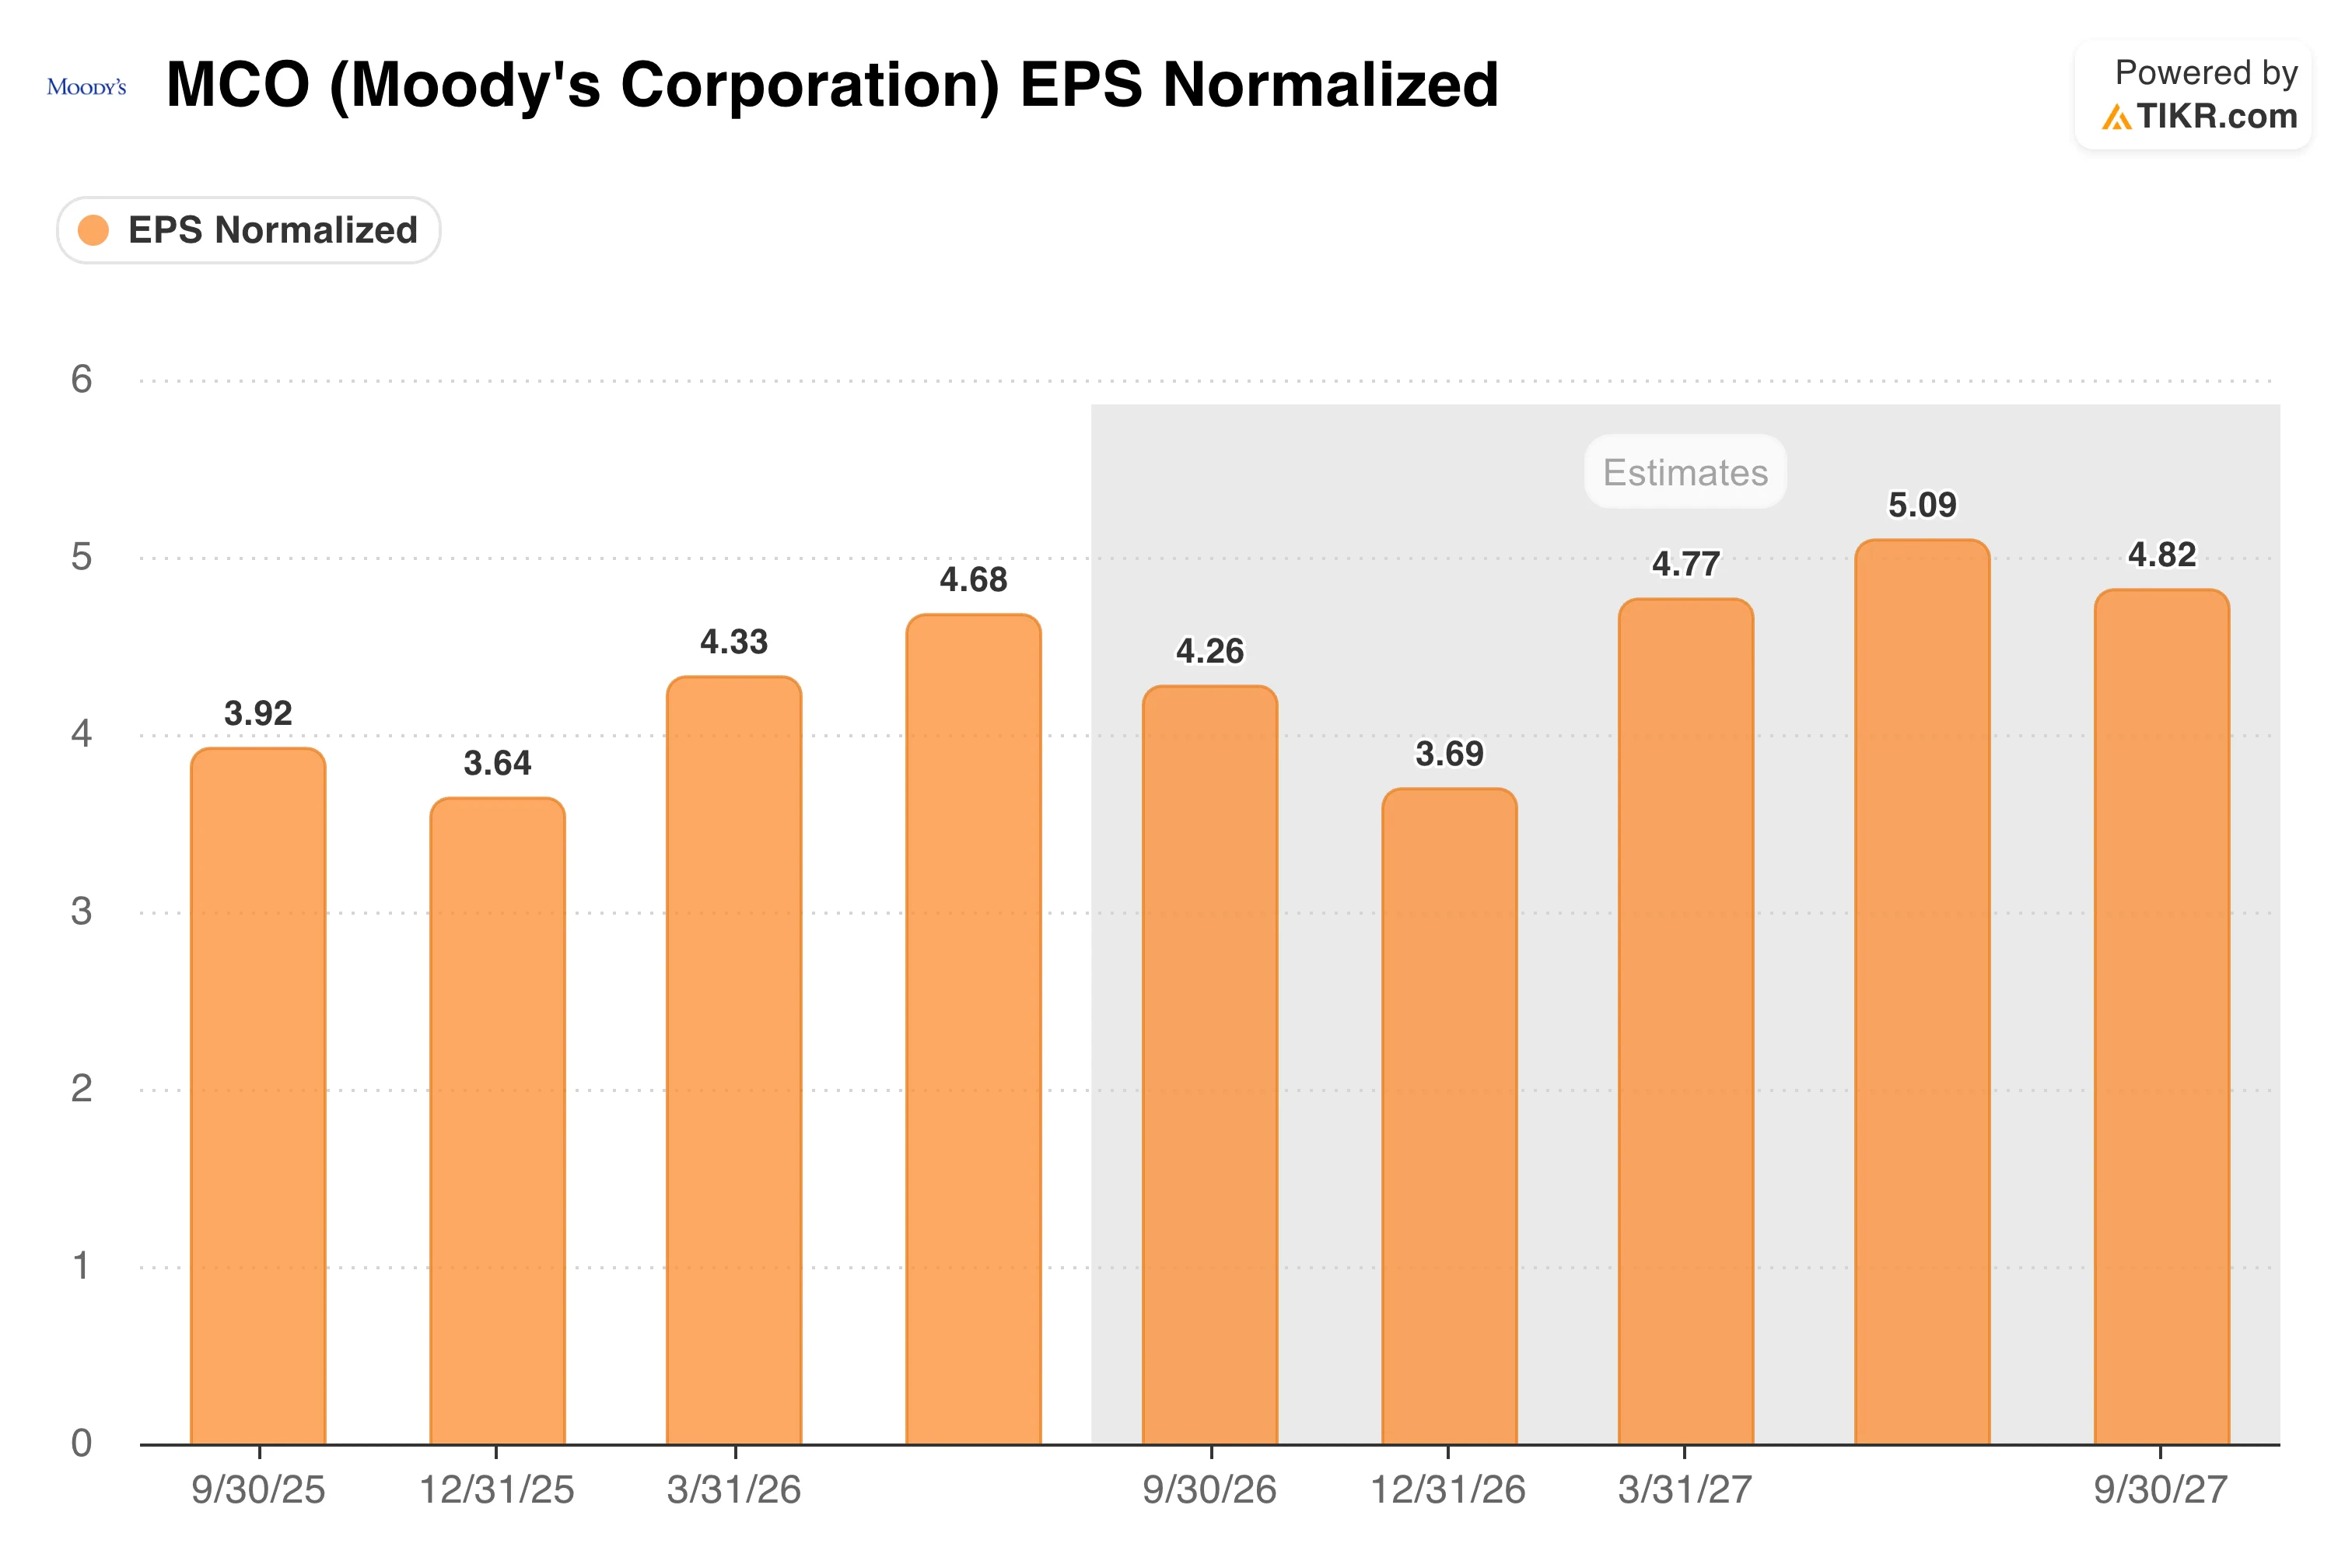
Adjusted diluted EPS came in at $4.68 in Q2, up 31% from the prior year. MA’s annualized recurring revenue reached $3.66 billion, up 9% year-over-year, and the adjusted operating margin improved to 33.6%.
Moody’s narrowed full-year adjusted EPS guidance to $16.50 to $17.00, first-half free cash flow reached $1.53 billion, and the company raised its full-year share repurchase target to up to $3 billion.
Read the full Moody’s Corporation on TIKR to see the 2026 guidance breakdown >>>
What Does the Valuation Model Say?
At around $471, Moody’s trades at roughly 26.5 times next-twelve-month earnings, which is not cheap for a business growing revenue in the mid-to-high single digits.
The TIKR valuation model clearly lays out the range of outcomes, with the mid-case arriving at a target price of around $730 over roughly four years.
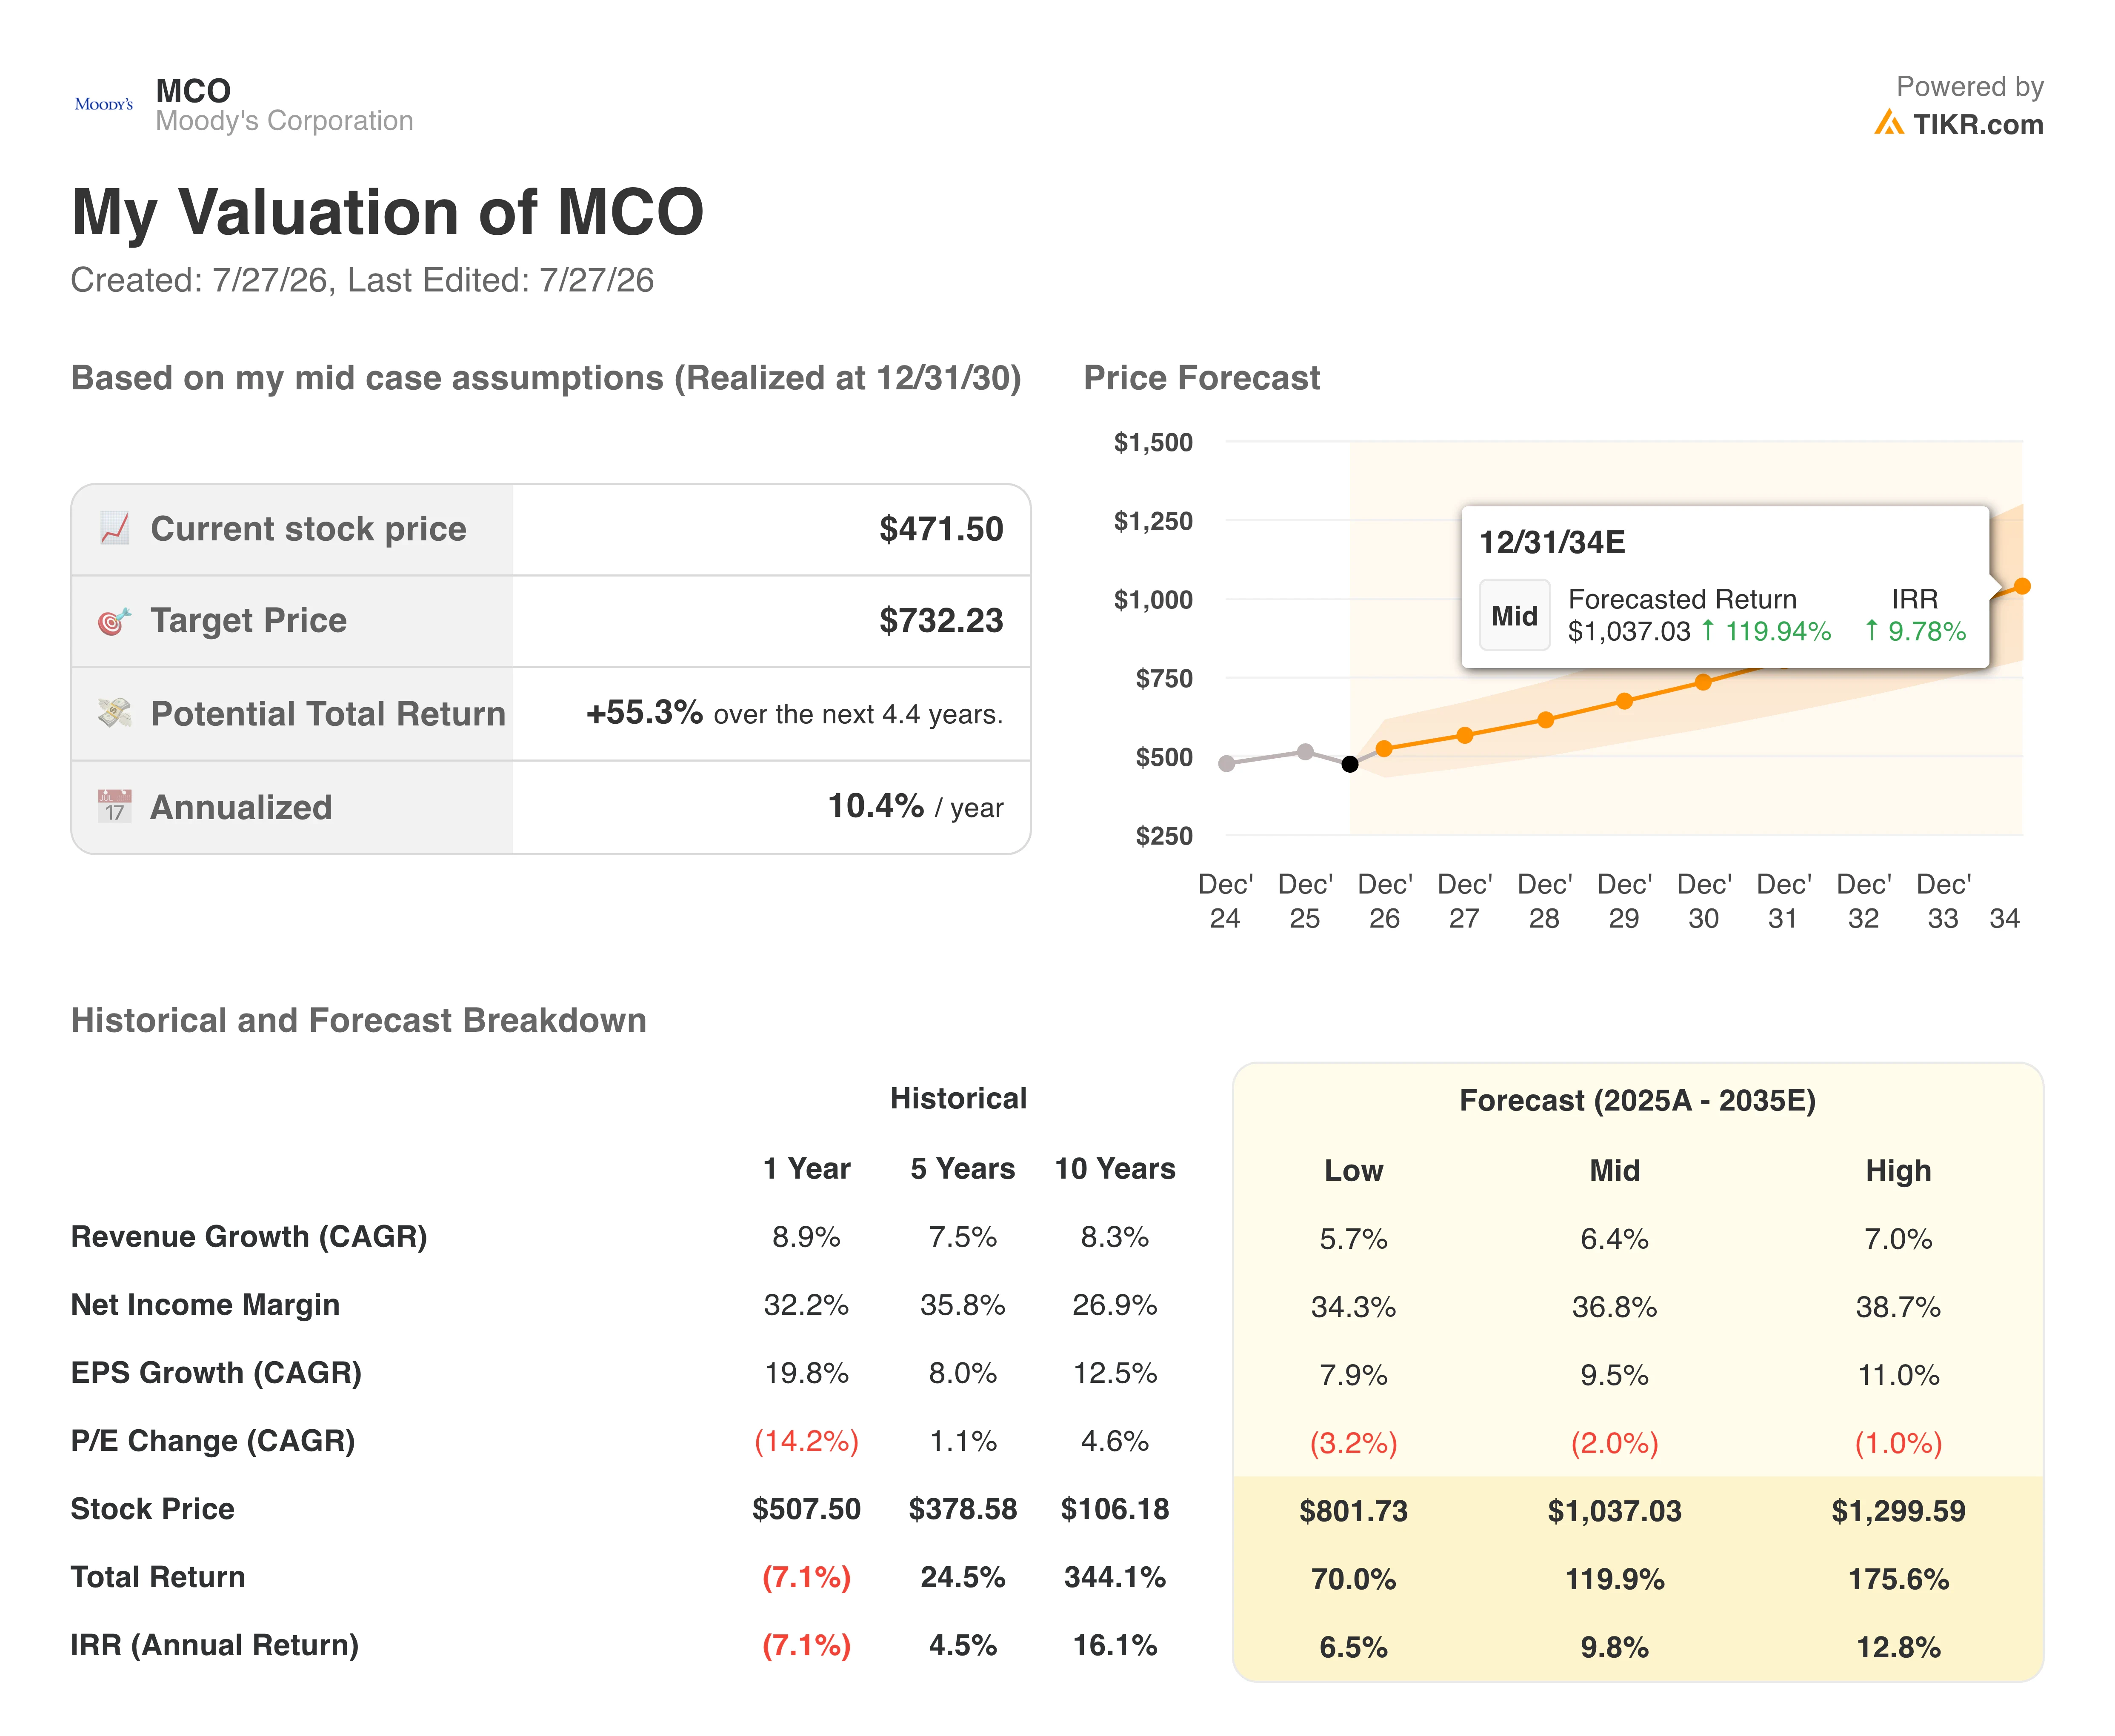
That mid-case assumes revenue growth of around 6% annually, with net income margins expanding toward 37%, translating to approximately 10% annualized returns.
Most of that return comes from earnings growth rather than multiple expansion, as the model assumes mild multiple compression of about 2% annually. The high case gets to a much higher price over a longer horizon at roughly 13% per year.
The scenario range skews to the upside over time, but the near-term mid-case is modest, and investors should go in with realistic expectations.
Should You Buy Moody’s Corporation Stock?
The bull case is straightforward, as MIS is benefiting from a genuine surge in global debt issuance driven by data centers and infrastructure buildout, while MA is quietly becoming one of the most valuable financial data platforms in the world, with nearly $3.7 billion in recurring revenue already contracted.
Margins are expanding, free cash flow is strong, and management is returning capital aggressively.
The honest counterpoint is that the stock reflects most of that quality. The TIKR mid-case implies around 10% annualized returns through 2030, which is respectable but not the margin of safety most long-term investors want.
Consensus estimates also point to some seasonal softness in the back half of 2026, and a weaker debt issuance environment could give the market reason to reprice. Moody’s is a high-quality business. The question is whether the current price is a high-quality entry point.
Access Professional Tools to Analyze MCO stock on TIKR for Free →
Looking for New Opportunities?
- See what stocks billionaire investors are buying so you can follow the smart money.
- Analyze stocks in as little as 5 minutes with TIKR’s all-in-one, easy-to-use platform.
- The more rocks you overturn… the more opportunities you’ll uncover. Search 100K+ global stocks, global top investor holdings, and more with TIKR.
Disclaimer:
Please note that the articles on TIKR are not intended to serve as investment or financial advice from TIKR or our content team, nor are they recommendations to buy or sell any stocks. We create our content based on TIKR Terminal’s investment data and analysts’ estimates. Our analysis might not include recent company news or important updates. TIKR has no position in any stocks mentioned. Thank you for reading, and happy investing!