Few stocks have taken investors on a wilder ride than Meta over the past three years.
A business that traded at single-digit earnings multiples in late 2022 has since recovered to trade roughly in line with the broader market, powered by one of the most remarkable corporate turnarounds among large-cap technology companies. The trailing P/E is approximately 28.06x today, with a forward P/E of roughly 21.83x based on the next 12 months’ earnings estimates.
Those numbers sit modestly below the long-run mean, which tells its own story. Meta (META) has re-rated significantly from its trough, but the market has not yet assigned the premium multiple that its current earnings growth might otherwise warrant. Understanding why requires looking at the full historical picture.
Now Live: Discover how much upside your favorite stocks could have using TIKR’s new Valuation Model (It’s free)>>>
Meta’s Current P/E in Context
At roughly 22x forward earnings, Meta trades at a discount to several mega-cap technology peers despite generating strong margins and double-digit revenue growth. The forward EV/EBITDA of approximately 11.87x and forward EV/Revenue of roughly 6.68x tell the same story. These are not rich multiples for a business performing the way Meta currently is.
The trailing P/E of 28.06x compares with a ten-year mean of approximately 30.51x, indicating the stock is modestly below its long-run average on a trailing basis despite the significant earnings recovery over the past two years.

One Year: Relative Calm After Years of Volatility
Over the past twelve months, Meta has traded in a fairly narrow band between approximately 20.97x and 33.21x, with a mean of roughly 27.17x. The current reading of 28.06x sits just above that one-year average, reflecting a modest bounce from the April 2026 selloff driven by tariff-related macro concerns and sensitivity around digital advertising budgets.

What is notable about the one-year range is how stable it looks compared to what came before. The market has largely settled into a 25x to 35x trading band, suggesting investors have reached a more stable view of the business’ actual value after years of genuine uncertainty.
Analyze META stock on TIKR Free→
Three Years: One of the Most Dramatic Swings in Large-Cap History
Zoom out to three years, and the picture changes completely. The mean P/E over this period is approximately 29.26x, with a range from 20.31x to 39.25x. That is an extraordinary swing for a company of Meta’s size.

The trough reflected peak pessimism about metaverse spending, rising costs, slowing ad revenue, and the lingering damage from Apple’s ATT privacy changes. The recovery through 2023 and into 2024, driven by Reels monetization, AI-powered ad targeting, and Zuckerberg’s year of efficiency, produced one of the fastest multiple expansions any large-cap stock has delivered in recent memory.
Five Years: The Full Arc From Panic to Recovery
The five-year view captures the entire narrative from pre-metaverse optimism to peak crisis to full recovery. The mean P/E sits at approximately 25.29x, with a high of 39.25x and a low of 8.45x.

What makes this chart worth studying is the speed of each move. The descent from 30x to below 9x took roughly eighteen months. The recovery back toward 30x took about the same time. For investors willing to look past operating losses and metaverse skepticism about the durability of the underlying advertising business, the trough was one of the clearest large-cap opportunities of the decade.
See what analysts think about Apple stock right now (Free with TIKR) >>>
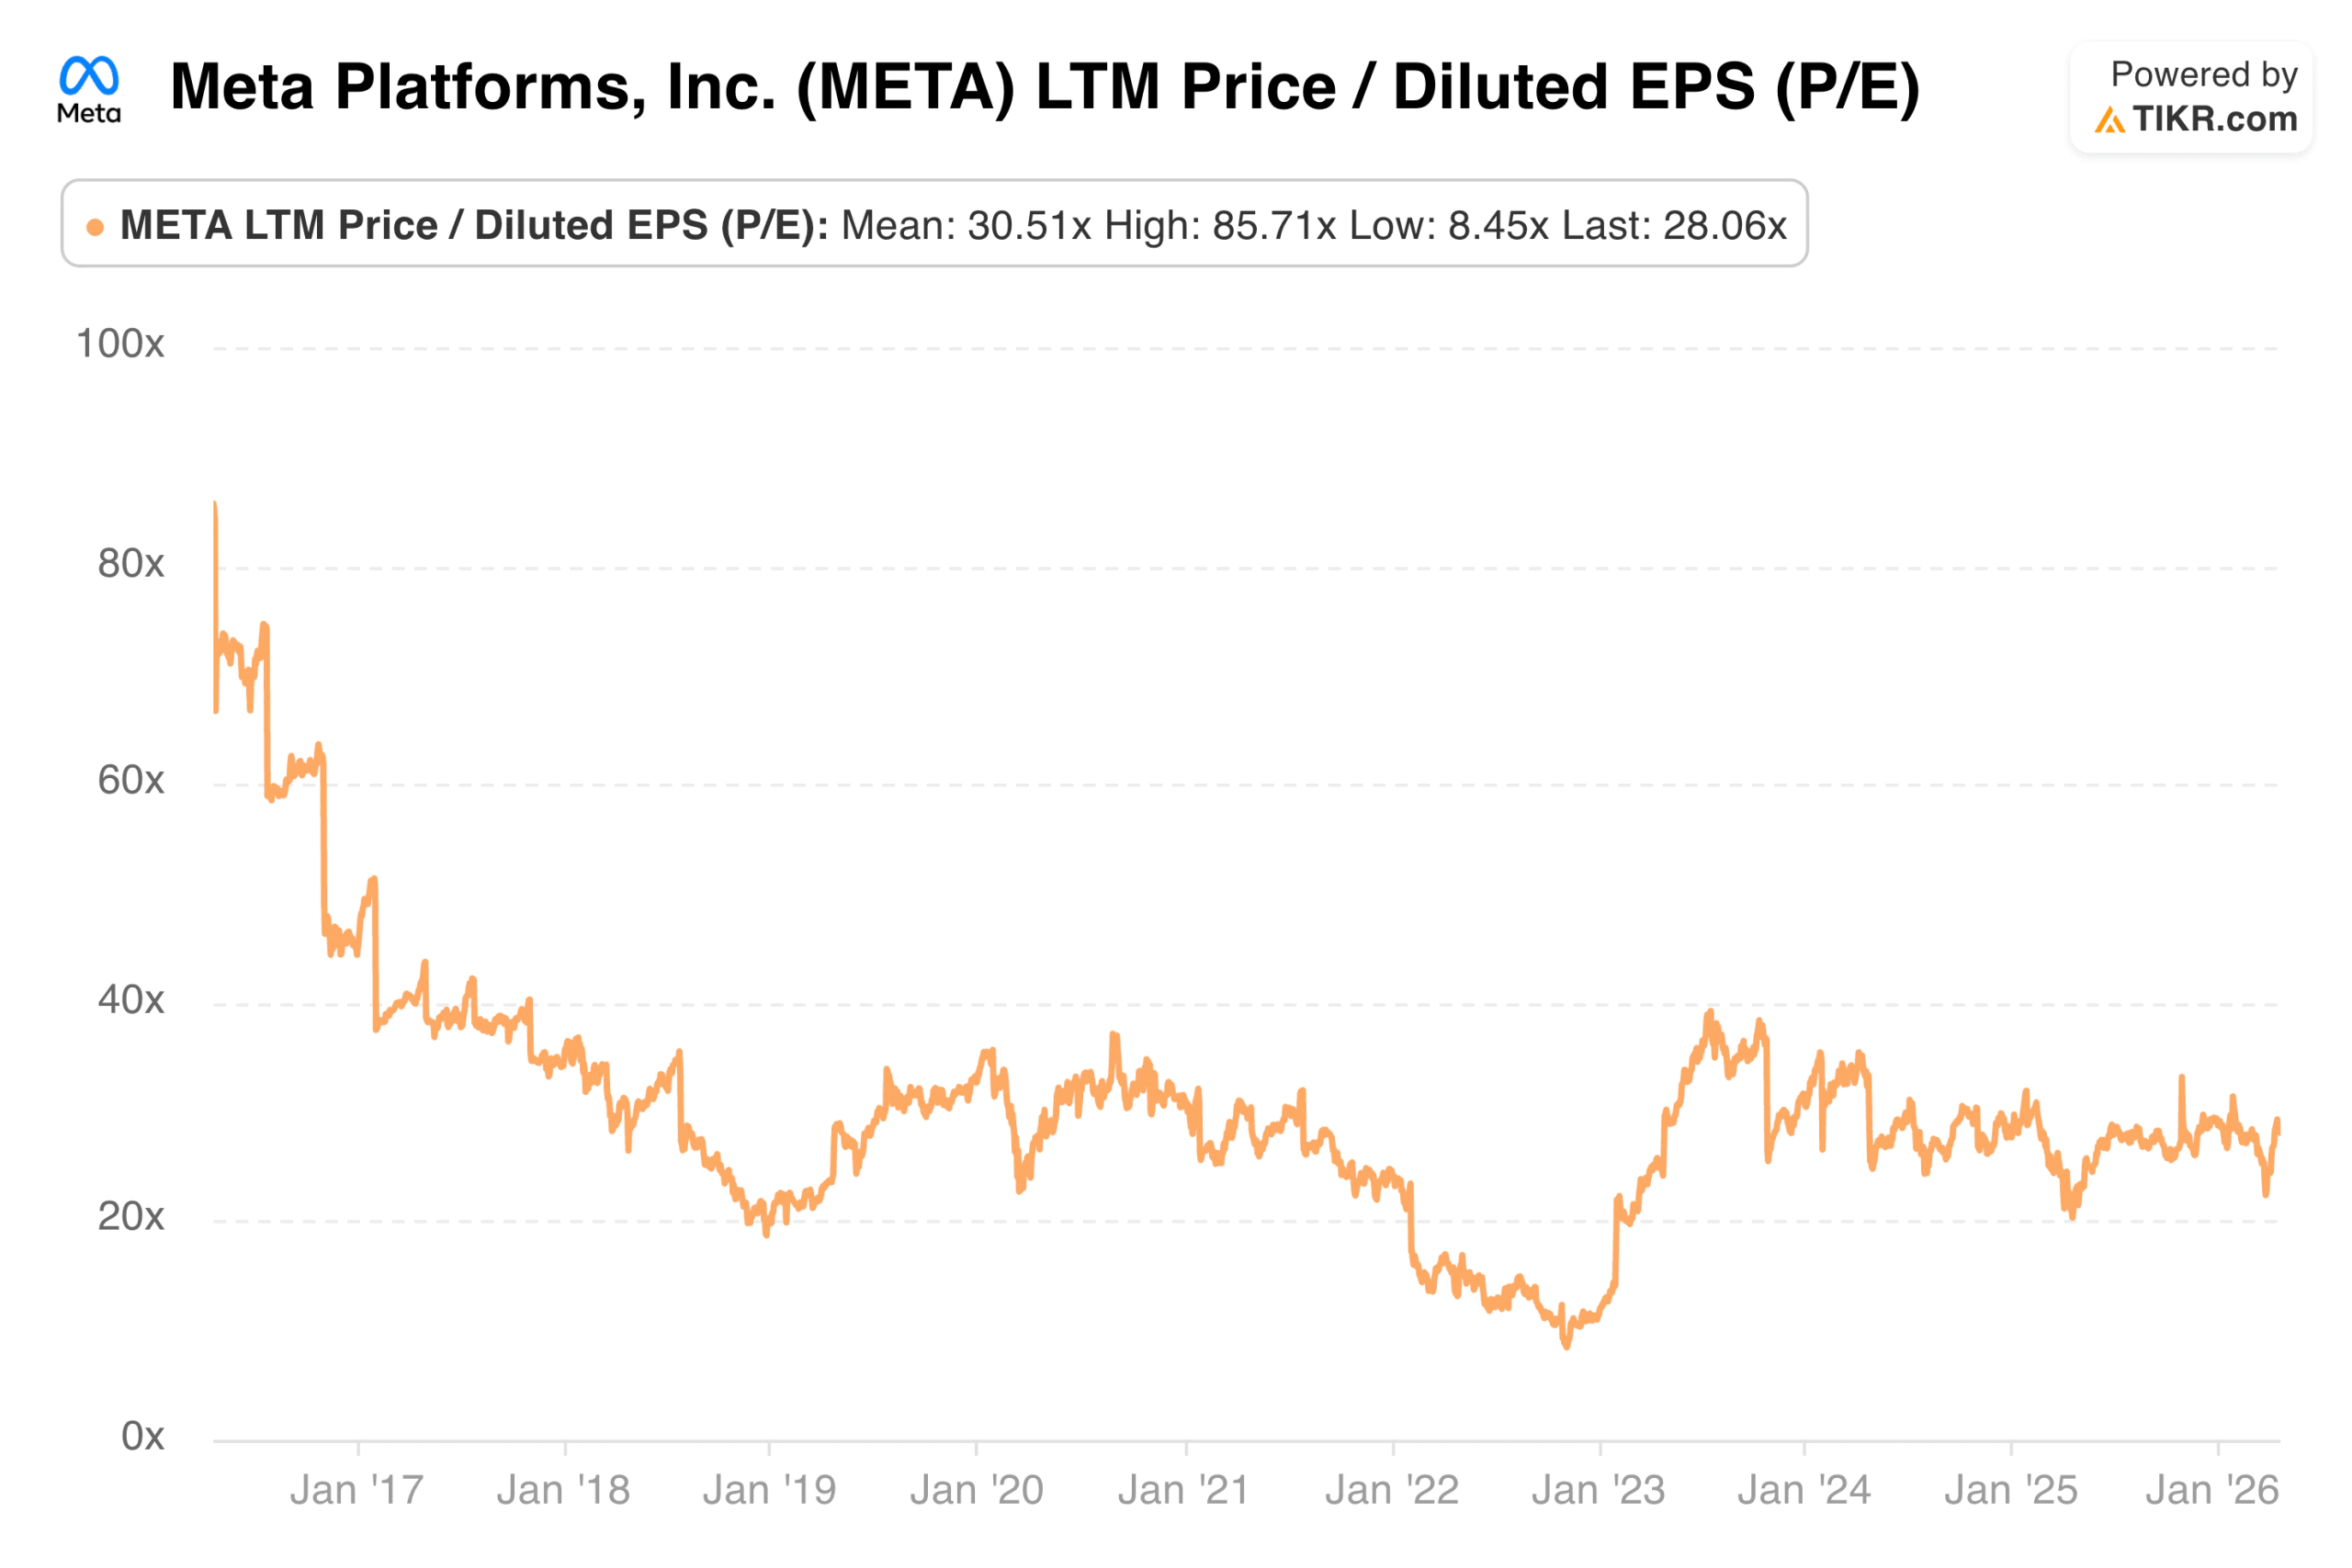
Ten Years: A Business the Market Has Never Quite Known How to Price
Pull back to the full ten-year view, and Meta looks like a business that has always created valuation debates. The mean P/E over this period is approximately 30.51x, the high is 85.71x from the early post-IPO years, and the low is the same 8.45x trough from 2022. The current reading of 28.06x sits modestly below the long-run mean.
Each phase of Meta’s history produced a distinct valuation regime: early growth euphoria, mobile monetization skepticism, the Cambridge Analytica regulatory discount, pandemic re-rating, metaverse collapse, and the current recovery. The market has rarely sat still on this one for long, which is part of what makes the current relative stability interesting.
See historical and forward estimates for Meta stock (It’s free!) >>>
The Story Behind the Re-Rating: From 8x to 28x in Two Years
The 2022 trough was not just about sentiment. Reality Labs losses were running at roughly $10 billion annually. Apple’s ATT changes had measurably hurt advertiser ROI on Meta’s platforms. User growth on Facebook’s core app was stalling. The market priced the stock as if the core advertising business was structurally impaired, not temporarily disrupted.
What followed was a simultaneous resolution of several of those concerns. Reels monetization accelerated faster than almost anyone expected. AI-powered tools through Meta’s Advantage+ platform partially offset the ATT damage by improving on-platform targeting. The year of efficiency cut costs aggressively, producing a surge in operating margins that translated directly into EPS growth, the old multiple simply did not anticipate.
The result was one of the fastest recoveries from a major multiple trough in the history of large-cap technology, not because the business fundamentally transformed, but because the market’s worst-case assumptions proved wrong.
The Bull Case for Sustaining a Premium Multiple
The bull case starts with AI continuing to improve advertising returns. Advantage+ uses machine learning to optimize placements, creative selection, and audience targeting to improve advertiser ROI without relying on third-party data. As that system matures, Meta’s ad inventory becomes more valuable per impression regardless of volume growth.
Llama’s positioning as an open-source AI platform is the second piece. By releasing its models openly, Meta has embedded itself in the AI development ecosystem in a way that creates talent attraction, industry influence, and future monetization optionality that does not yet appear in any consensus model.
Reality Labs’ losses eventually narrowing would provide a third mechanical boost. Even modest improvement in that segment’s cost structure, without a corresponding increase in revenue, flows directly into earnings per share, which the current multiple does not fully reflect.
The Bear Case for Multiple Compression
Reality Labs remains the most visible structural concern as it has burned tens of billions of dollars with limited commercial traction, and there is no clear timeline for when the investment will produce something that justifies the capital. Investors who view this as value destruction rather than option value have a reasonable case that the losses represent a permanent drag on returns.
Regulatory risk around data privacy and teen safety is real and growing. Multiple jurisdictions are investigating Meta’s practices, and any outcome that restricts ad targeting or imposes behavioral changes on the platform could reduce the precision and effectiveness of the advertising business in ways that are hard to model but potentially material.
The macro sensitivity of digital advertising is the third consideration. Ad budgets are among the first things cut during economic slowdowns, and Meta’s revenue base is more cyclically exposed than its forward multiple implies. Even a modest pullback in advertising spending creates earnings pressure on a valuation that has little cushion.
See how Meta performs against its peers in TIKR (It’s free!) >>>
What the Current Multiple Implies
At roughly 22x forward earnings with operating margins expanding and revenue growing at double-digit rates, Meta does not look expensive by any historical standard. The forward P/E sits below both the five-year mean of roughly 25.29x and the ten-year mean of 30.51x, meaning the market is effectively applying a discount to current earnings relative to history.

Under mid-case assumptions, TIKR’s valuation model targets a price of approximately $1,255 by December 2030, implying roughly 90% total upside and approximately 15% annualized returns from current levels. That scenario embeds revenue growing at roughly 15% annually, with net income margins holding near 33%. The high case, where revenue grows closer to 17% annually, implies approximately 171% total upside. Even the low case generates roughly 96% total upside, suggesting the range of outcomes is tighter than the stock’s historical volatility might imply.
That discount likely reflects a combination of uncertainty around Reality Labs, regulatory overhang, and macro sensitivity. Whether it represents an opportunity or an appropriate risk adjustment comes down to how much weight investors place on those risks against an advertising business that is arguably executing better today than at any prior point in its history.
Build your own Valuation Model to value any stock (It’s free!) >>>
How Much Upside Does META Stock Have From Here?
With TIKR’s new Valuation Model tool, you can estimate a stock’s potential share price in under a minute.
All it takes is three simple inputs:
- Revenue Growth
- Operating Margins
- Exit P/E Multiple
If you’re not sure what to enter, TIKR automatically fills in each input using analysts’ consensus estimates, giving you a quick, reliable starting point.
From there, TIKR calculates the potential share price and total returns under Bull, Base, and Bear scenarios so you can quickly see whether a stock looks undervalued or overvalued.
See a stock’s true value in under 60 seconds (Free with TIKR) >>>
Looking for New Opportunities?
- See what stocks billionaire investors are buying so you can follow the smart money.
- Analyze stocks in as little as 5 minutes with TIKR’s all-in-one, easy-to-use platform.
- The more rocks you overturn… the more opportunities you’ll uncover. Search 100K+ global stocks, global top investor holdings, and more with TIKR.
Disclaimer:
Please note that the articles on TIKR are not intended to serve as investment or financial advice from TIKR or our content team, nor are they recommendations to buy or sell any stocks. We create our content based on TIKR Terminal’s investment data and analysts’ estimates. Our analysis might not include recent company news or important updates. TIKR has no position in any stocks mentioned. Thank you for reading, and happy investing!