Key Stats for American Airlines Stock
- Current Price: $11.68
- Target Price (Mid): ~$14
- Street Target: ~$15
- Potential Total Return: ~20%
- Annualized IRR: ~2% / year
- Earnings Reaction: +2.72% (April 23, 2026)
- Max Drawdown: 37.39% (March 30, 2026)
Now Live: Discover how much upside your favorite stocks could have using TIKR’s new Valuation Model (It’s free) >>>
What Happened?
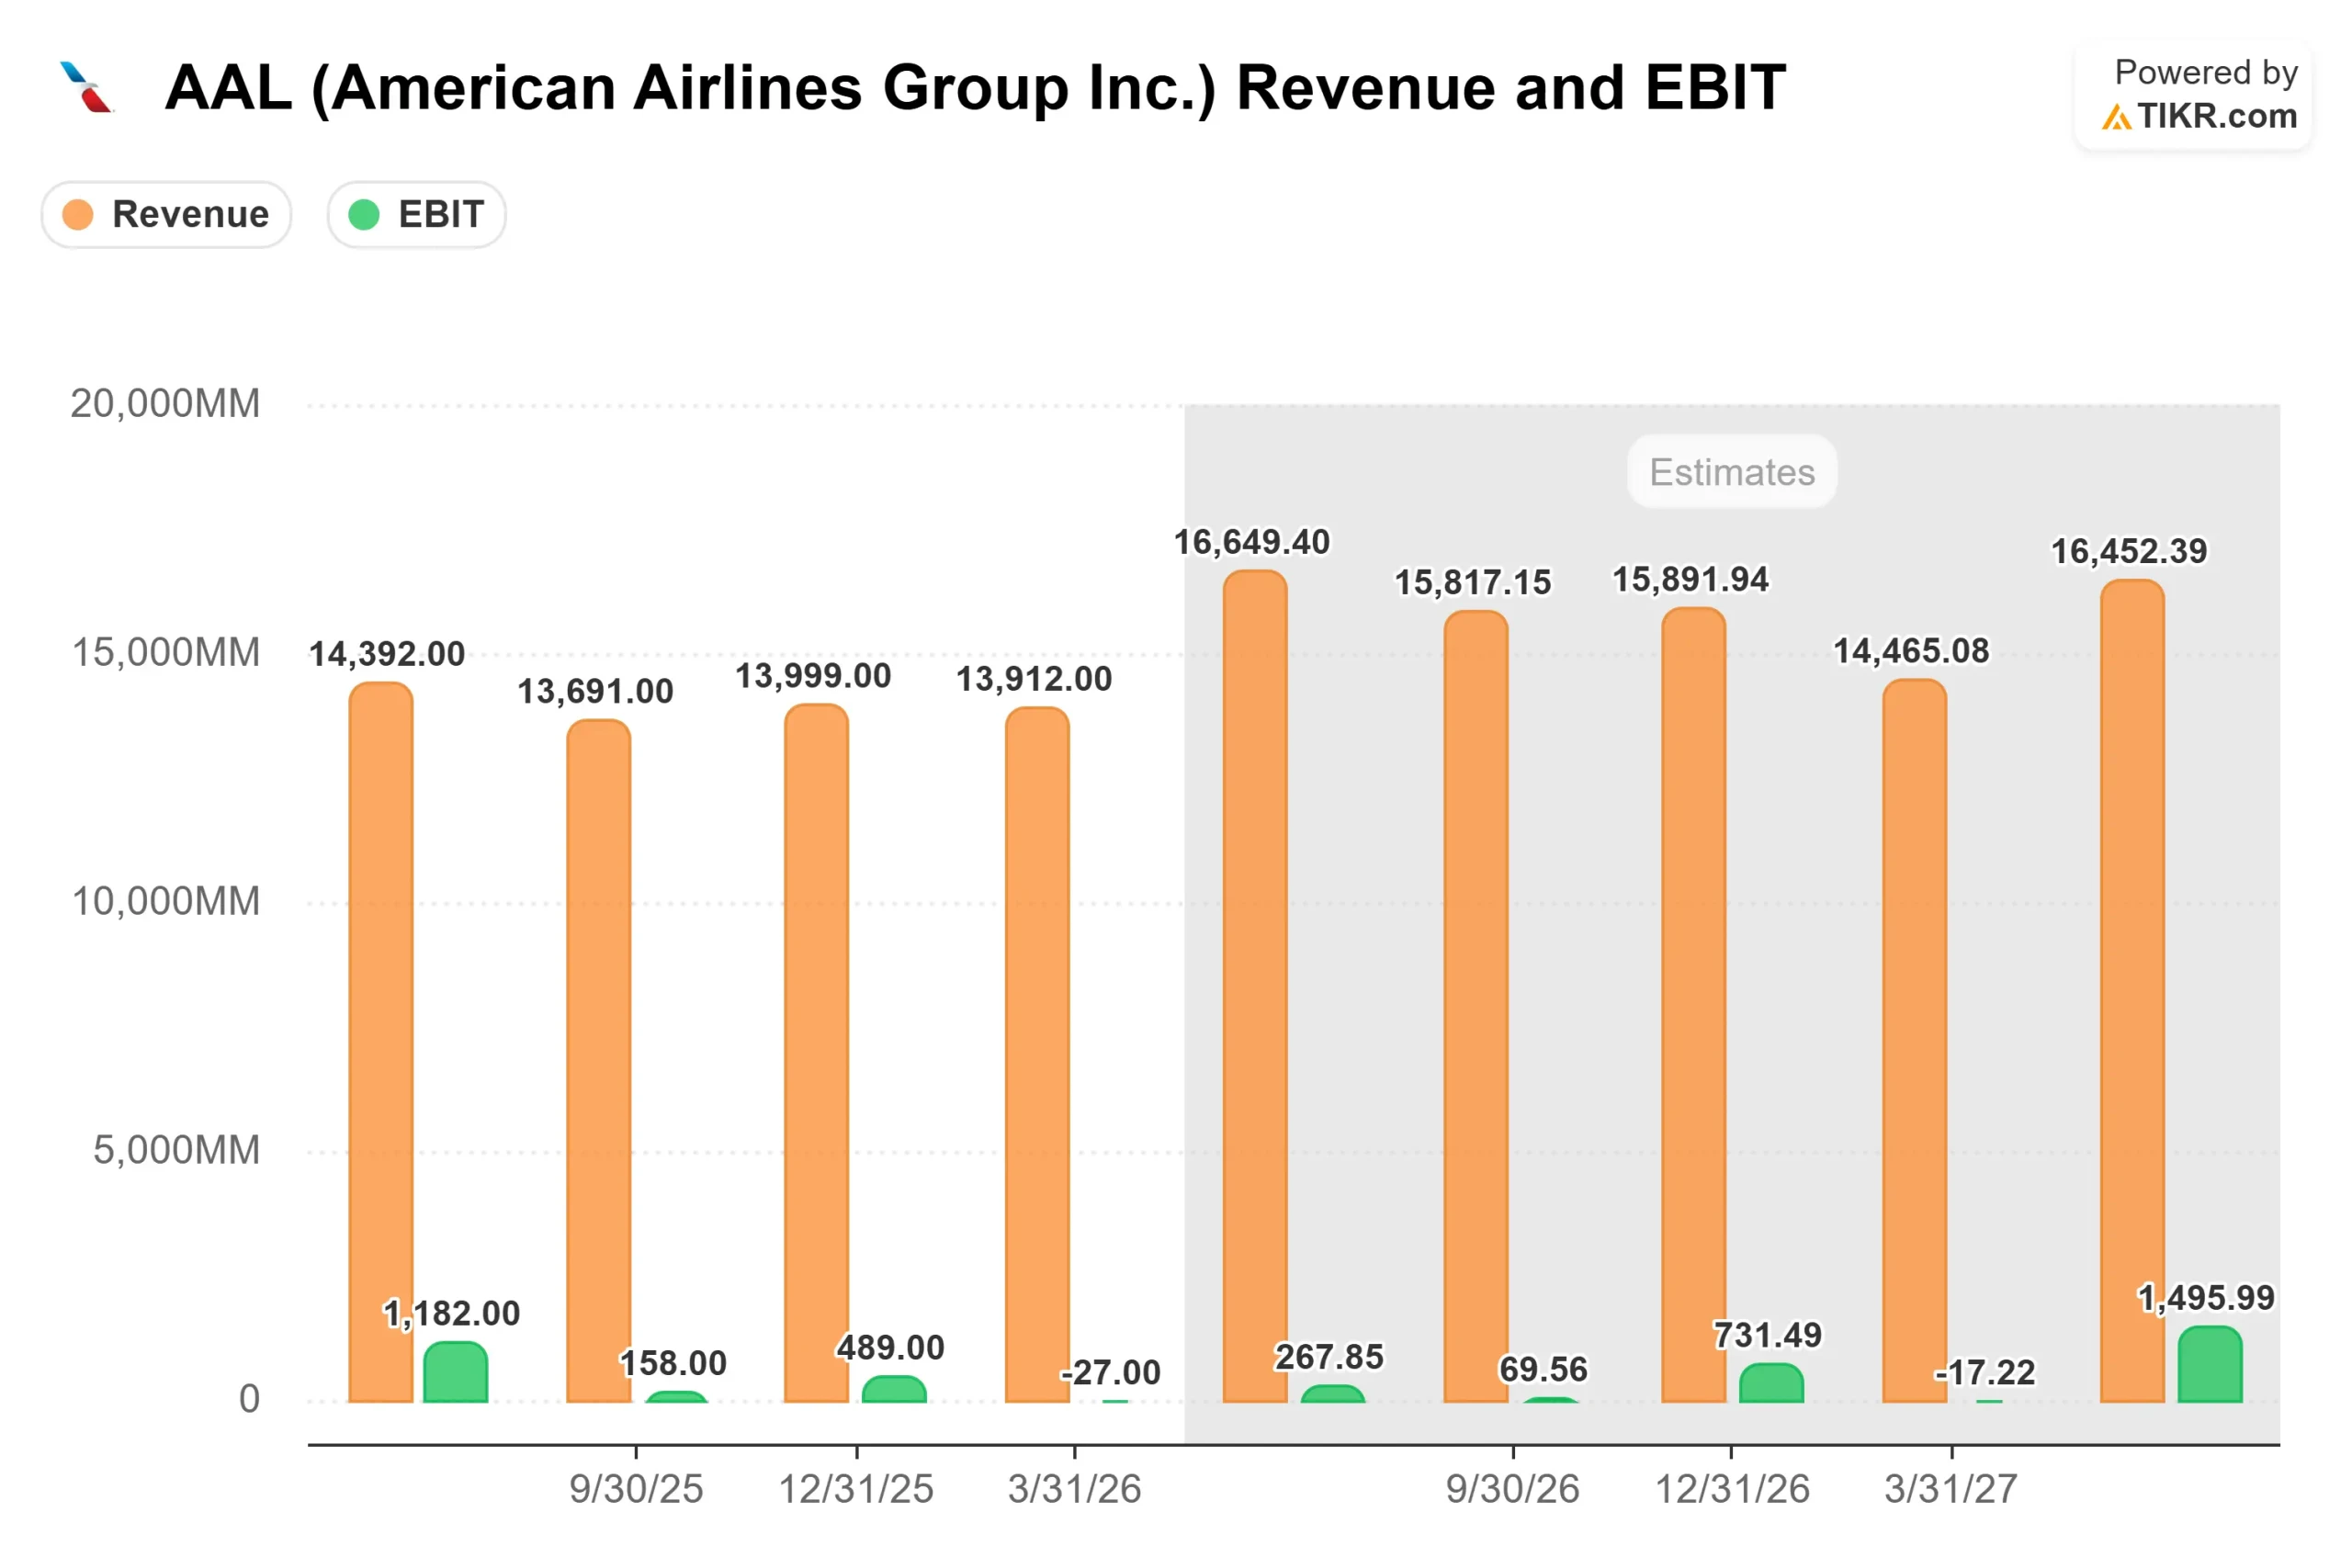
American Airlines Group (AAL) has fallen roughly 24% year to date, sitting at $11.68 as investors absorb what management confirmed on the April 23 earnings call: a more than $4 billion increase in jet fuel expense for 2026, driven by the U.S.-Israeli strikes on Iran.
The full-year earnings guidance range now spans from a $0.40 loss to $1.10 in profit, down sharply from the $1.70 to $2.70 range issued in January. For a highly leveraged airline with razor-thin margins, the fuel shock leaves almost no cushion.
But the market may be so focused on what it cannot control that it is missing what American has actually built. Paid load factors in business class and premium economy tracked 10 percentage points above 2019 levels in Q1 2026. AAdvantage loyalty enrollments hit a record, rising 25% year over year.
CEO Robert Isom said it plainly on the call: “There’s been a drive to a premium product. American has been a big part of that.”
The real question is not whether fuel hurts 2026. It already has. The question is whether the commercial reinvention has permanently raised the earnings floor for when fuel normalizes.
See historical and forward estimates for American Airlines stock (It’s free!) >>>
Is American Airlines Undervalued Today?
The loyalty program is the cleanest argument for a structurally higher earnings floor. Under a new 10-year exclusive agreement, Citi became the sole U.S. issuer of AAdvantage co-branded cards in 2026, with annual cash remuneration projected to approach $10 billion per year and a $1.5 billion annual pre-tax income benefit versus 2024 levels.
That figure comes from American Airlines’ own SEC filing. On the Q1 call, CFO Devon May guided that loyalty marketing revenue would run at around $1 billion per quarter for 2026, with less quarter-to-quarter volatility than in prior years. Co-branded card spend grew 9% year over year in Q1, and card acquisitions set all-time records.
The corporate recovery adds to that picture. Managed corporate revenue grew 13% year over year, and bookings from small and medium enterprises rose 28% year over year. On the international side, Atlantic unit revenue jumped 16.7% year over year, with London Heathrow up 25%. The Pacific delivered 7.8% unit revenue growth. These numbers reflect a commercial operation that has regained share lost during American’s 2024 distribution missteps and is now extending beyond it.
The risks are real. Financial media reported that CFRA downgraded AAL from Buy to Hold after Q1, citing the fuel headwind. Net debt sits at around $27 billion, and the LTM Net Debt/EBITDA ratio of 2.63x limits flexibility if fuel stays elevated. The NTM EV/EBITDA of 7.14x looks inexpensive on the surface, but the NTM P/E is deeply negative, meaning the market is pricing 2026 as a near-zero earnings year.
What makes the medium-term setup more interesting is the free cash flow trajectory. TIKR estimates show FCF recovering to around $476 million in 2027 and expanding toward $1.25 billion in 2028 as fuel costs normalize and debt service declines. Notably, American cut its total debt by $1.8 billion in Q1 alone, dropping below $35 billion for the first time since mid-2015, even while absorbing the full fuel shock. That is the balance sheet discipline the bull case depends on.

See how American Airlines performs against its peers in TIKR (It’s free!) >>>
TIKR Advanced Model Analysis
- Current Price: $11.68
- Target Price (Mid): ~$14
- Potential Total Return: ~20%
- Annualized IRR: ~2% / year

See analysts’ growth forecasts and price targets for American Airlines stock (It’s free!) >>>
The TIKR mid-case model targets around $14 by 12/31/30, based on a revenue CAGR of around 2% through 2030, driven by loyalty remuneration growth and premium cabin yield expansion, with a net income margin around 3%. The total return of roughly 20% over that period implies around 2% annualized. It is a modest return on its own.
The high case targets around $18 by 12/31/30. That scenario requires fuel to moderate, the Citi loyalty partnership to track toward the $10 billion annual remuneration target, and corporate travel to keep building. In that outcome, an EPS CAGR of around 26% drives the bulk of the return as operating leverage compounds. The low case, around $11 by 12/31/30, reflects sustained fuel pressure and a loyalty ramp that stalls. At $11.68 today, the stock is close to pricing that outcome already.
The Street mean target of around $15, from 24 analysts including 11 Buys, 2 Outperforms, 12 Holds, and 1 Sell, sits between the TIKR mid and high cases. Susquehanna maintained a Positive rating on AAL while lowering its price target to $16 from $17 following the Q1 results.
Conclusion
The metric to watch at the Q2 2026 report, expected July 22, 2026, is domestic unit revenue. Management guided for more than 10% domestic RASM (revenue per available seat mile) growth in Q2. If that lands and fuel recapture tracks toward the 75% to 85% range guided for Q3, the second-half earnings path becomes far more visible.
AAL is a leveraged bet on the durability of premium travel and loyalty demand through a fuel cycle. At $11.68, the stock is pricing close to the downside case while the commercial fundamentals continue to produce record results.
See what stocks billionaire investors are buying so you can follow the smart money with TIKR.
Should You Invest in American Airlines?
The only way to really know is to look at the numbers yourself. TIKR gives you free access to the same institutional-quality financial data that professional analysts use to answer exactly that question.
Pull up American Airlines, and you’ll see years of historical financials, what Wall Street analysts expect for revenue and earnings in the quarters ahead, how valuation multiples have moved over time, and whether price targets are trending up or down.
You can build a free watchlist to track American Airlines alongside every other stock on your radar. No credit card required. Just the data you need to decide for yourself.
Analyze American Airlines on TIKR Free →
Looking for New Opportunities?
- See what stocks billionaire investors are buying so you can follow the smart money.
- Analyze stocks in as little as 5 minutes with TIKR’s all-in-one, easy-to-use platform.
- The more rocks you overturn… the more opportunities you’ll uncover. Search 100K+ global stocks, global top investor holdings, and more with TIKR.
Disclaimer:
Please note that the articles on TIKR are not intended to serve as investment or financial advice from TIKR or our content team, nor are they recommendations to buy or sell any stocks. We create our content based on TIKR Terminal’s investment data and analysts’ estimates. Our analysis might not include recent company news or important updates. TIKR has no position in any stocks mentioned. Thank you for reading, and happy investing!