
Key Takeaways:
- MedTech Momentum: Johnson & Johnson highlighted 90% 12-month effectiveness in the 30-patient OMNY-AF pilot and reported a 0% acute adverse event rate, supporting its push to defend electrophysiology share in pulsed-field ablation.
- Litigation Catalyst: Johnson & Johnson received a New Jersey appeals-court ruling that removed Beasley Allen from state talc cases, a development that can reshape legal posture across 67000 federal claims and 3600 New Jersey filings.
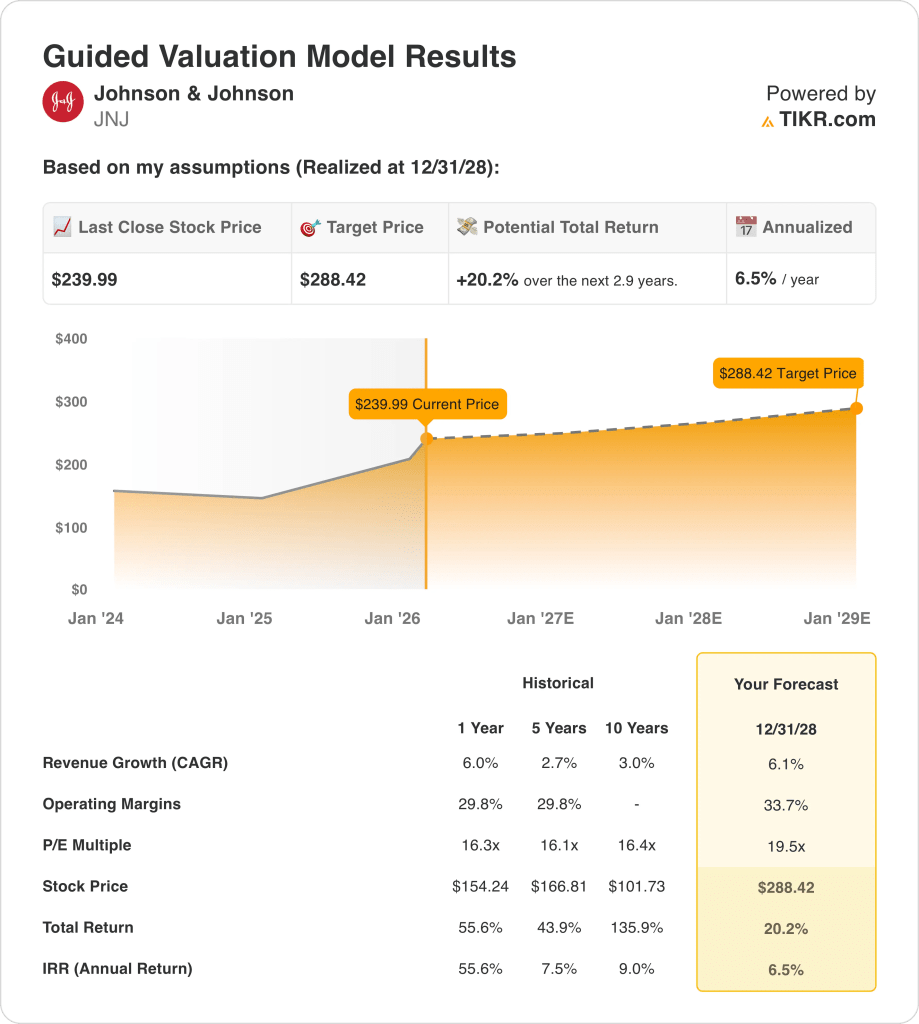
- Price Path: Johnson & Johnson stock could reach $288 by 2028 as the model prices in 6% revenue growth and 34% operating margins with a 20x P/E multiple.
- Return Math: Johnson & Johnson upside is 20% from the $240 current price to $288, implying a 7% annualized return through 2028.
Johnson & Johnson (JNJ) generates revenue from patented pharmaceuticals and global MedTech devices across Innovative Medicine and MedTech, selling through hospitals, physicians, clinics, and distributors in major healthcare markets.
Last year, Johnson & Johnson generated about $94 billion of revenue and $64 billion of gross profit, reflecting a 68% gross margin supported by scale in immunology, oncology, cardiovascular devices, and vision care.
JNJ also spent $38 billion on operating expenses in 2025, delivered $26 billion of operating income, and held a 27% operating margin that anchors its ability to fund R&D while absorbing policy and pricing pressure.
Management framed 2025 as a reset year for portfolio velocity, with its CEO Joaquin Duato saying, “We said 2025 would be a catapult year for Johnson & Johnson, and that’s exactly what it was.”
The company pointed to $32 billion invested in R&D and M&A during 2025, including Intra-Cellular Therapies and Halda Therapeutics, while also progressing toward a mid-2027 Orthopaedics separation to concentrate on higher-growth segments.
MedTech growth visibility increased in February 2026 as Johnson & Johnson presented OMNY-AF pilot results showing 90% primary effectiveness at 12 months and introduced workflow-enhanced VARIPULSE data across 6811 patients with a 0% neurovascular event rate rounded to 0.
At the same time, the JNJ stock faces perception risk from talc headlines even as the valuation framework assumes a 20x 2028 multiple, leaving debate over whether a 7% annualized path reflects enough compensation for litigation noise.
What the Model Says for JNJ Stock
Johnson & Johnson’s diversified healthcare portfolio generates steady cash flows, but litigation exposure and scale limit upside despite stable execution and moderate capital intensity.
The model assumes 6.1% revenue growth, 33.7% operating margins, and a 19.5x exit multiple, resulting in a $288 target price by 2028.
The implied 20.2% total upside and 6.5% annualized return sit below typical opportunity costs for long-only public equity capital.
The model signals a Sell because the return profile does not compensate for equity risk given muted growth and limited valuation expansion.
A 6.5% annualized return below a 10% equity hurdle prioritizes capital preservation over appreciation, as litigation, policy exposure, and execution demands outweigh expected valuation gains.
Our Valuation Assumptions
TIKR’s Valuation Model lets you plug in your own assumptions for a company’s revenue growth, operating margins, and P/E multiple, and calculates the stock’s expected returns.
Here’s what we used for Johnson & Johnson stock:
1. Revenue Growth: 6.1%
Johnson & Johnson’s revenue base has expanded steadily, supported by diversified exposure across Innovative Medicine and MedTech, with 1-year historical growth of 6%.
Current execution reflects continued momentum from oncology, immunology, and cardiovascular platforms, alongside portfolio pruning that sustains mid-single-digit top-line expansion near 6%.
Growth depends on continued uptake of new therapies, smooth post-STELARA normalization, and steady MedTech demand, while policy pressure, pricing controls, or pipeline delays would slow expansion.
This is above the 1-year historical revenue growth of 6%, indicating the model assumes durable growth rather than structural acceleration.
2. Operating Margins: 33.7%
JNJ stock has historically sustained operating margins near 30%, reflecting scale, pricing power in Innovative Medicine, and disciplined cost management across a mature healthcare portfolio.
Recent performance shows margin resilience despite litigation costs and reinvestment, supported by higher mix from oncology and immunology and improving MedTech profitability.
This is above the 1-year historical operating margin of 30%, indicating the model assumes improved efficiency rather than stable reinvestment intensity.
3. Exit P/E Multiple: 19.5x
The exit multiple capitalizes terminal earnings for a mature healthcare company with stable cash flows, diversified end markets, and limited cyclicality.
The model embeds earnings durability from defensive demand, strong balance sheet capacity, and predictable free cash flow generation rather than rapid growth expectations.
This is above the 1-year historical P/E multiple of 16×, indicating the model assumes modest re-rating rather than valuation normalization.
What Happens If Things Go Better or Worse?
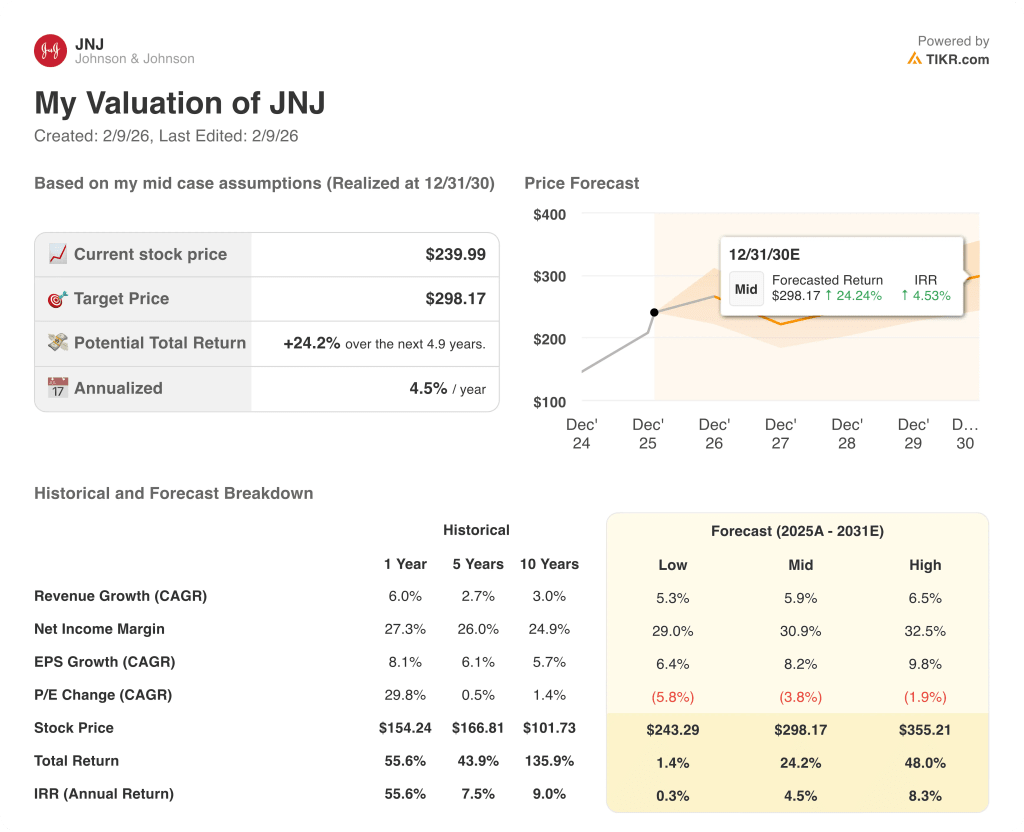
Johnson & Johnson stock outcomes depend on drug pipeline execution, MedTech demand stability, and litigation resolution pace, setting up a range of paths through 2030.
- Low Case: If pricing pressure persists and MedTech demand softens, revenue grows 5.3% and margins hold near 29.0% → 0.3% annualized return.
- Mid Case: With core pharmaceuticals steady and MedTech execution stable, revenue growth reaches 5.9% and margins improve to 30.9% → 4.5% annualized return.
- High Case: If pipeline launches scale and MedTech mix improves, revenue expands 6.5% and margins rise to 32.5% → 8.3% annualized return.
How Much Upside Does Johnson & Johnson Stock Have From Here?
With TIKR’s new Valuation Model tool, you can estimate a stock’s potential share price in under a minute.
All it takes is three simple inputs:
- Revenue Growth
- Operating Margins
- Exit P/E multiple
If you’re not sure what to enter, TIKR automatically fills in each input using analysts’ consensus estimates, giving you a quick, reliable starting point.
From there, TIKR calculates the potential share price and total returns under Bull, Base, and Bear scenarios so you can quickly see whether a stock looks undervalued or overvalued.
Looking for New Opportunities?
- See what stocks billionaire investors are buying so you can follow the smart money.
- Analyze stocks in as little as 5 minutes with TIKR’s all-in-one, easy-to-use platform.
- The more rocks you overturn… the more opportunities you’ll uncover. Search 100K+ global stocks, global top investor holdings, and more with TIKR.
Disclaimer:
Please note that the articles on TIKR are not intended to serve as investment or financial advice from TIKR or our content team, nor are they recommendations to buy or sell any stocks. We create our content based on TIKR Terminal’s investment data and analysts’ estimates. Our analysis might not include recent company news or important updates. TIKR has no position in any stocks mentioned. Thank you for reading, and happy investing!