
Key Takeaways:
- Operational Reset: Last week, lululemon stock shifted North America GEC to full-time staffing, affecting 100 roles, reinforcing service consistency amid execution scrutiny.
- Product Execution: In January, lululemon stock resumed $108 Get Low leggings online after complaints, following a 6% share drop tied to quality perception.
- Price Outlook: Based on moderated growth and margin normalization, lululemon stock could reach a $205 target price by January 2028.
- Upside Math: From a $173 current price, lululemon stock’s $205 target implies 19% total upside, translating to 9% annualized over 2 years.
Lululemon (LULU) represents a global premium athletic apparel brand, competing at scale across $11 billion revenue categories spanning yoga, training, and lifestyle.
Last week, Lululemon stock faced renewed scrutiny after reinstating its Get Low line, while governance pressure intensified following a 50% share decline in 2025.
Lululemon generated about $11 billion in LTM revenue, reflecting brand reach and pricing power despite slower Americas growth versus overseas markets.
Operating margins near 23% and roughly $2 billion operating income highlight efficiency, supporting profitability alongside disciplined cost control and selective investment.
Despite a $50 billion market value, Lululemon stock trades near 14x earnings, creating tension between stabilized fundamentals and restrained valuation assumptions.
What the Model Says for LULU Stock
We analyzed LULU stock using conservative assumptions reflecting brand reset, disciplined cost control, and a stabilized premium positioning.
Based on 4.8% revenue growth, 17.9% operating margins, and a 13.9x exit multiple, the model estimates $204.64.
That implies 18.6% total upside from $172.54, equating to an 8.9% annual return over 2.0 years.

Our Valuation Assumptions
TIKR’s Valuation Model lets you plug in your own assumptions for a company’s revenue growth, operating margins, and P/E multiple, and calculates the stock’s expected returns.
Here’s what we used for LULU stock:
1. Revenue Growth: 4.8%
Lululemon delivered historical revenue growth above 20% as brand momentum and store expansion accelerated across North America and early international markets.
Recent growth slowed as Americas demand softened, product recalls disrupted launches, and leadership transitions weighed on near-term execution consistency.
Also, its international expansion, digital penetration, and men’s categories support continued growth, while competition and consumer caution limit a rapid rebound.
According to surveyed analyst expectations, a 4.8% revenue growth assumption reflects durable global demand balanced against maturity and execution risk.
2. Operating Margins: 17.9%
Lululemon historically generated operating margins above 22% during peak demand cycles supported by full-price selling and supply chain efficiency.
Margins compressed as promotions increased, labor costs rose, and inventory actions followed product quality issues across core women’s categories.
Pricing discipline, scale benefits, and mix improvements support stabilization, while reinvestment and restructuring costs cap near-term recovery.
Based on aggregated analyst estimates.A 17.9% operating margin assumption reflects normalized profitability without assuming prior peak efficiency.
3. Exit P/E Multiple: 13.9x
Lululemon previously traded above 30x earnings when growth visibility was strong and leadership continuity reinforced investor confidence.
Valuation reset followed slowing growth, governance disputes, and heightened scrutiny after repeated product execution missteps.
Multiple expansion depends on consistent revenue recovery, leadership stability, and restored product credibility across core markets.
A 13.9x exit multiple reflects balanced confidence in recovery without speculative rerating, according to consensus analyst estimates.
What Happens If Things Go Better or Worse?
Lululemon’s outcomes depend on brand relevance, product execution, and cost control, creating varied paths through 2030 as leadership and demand stabilize.
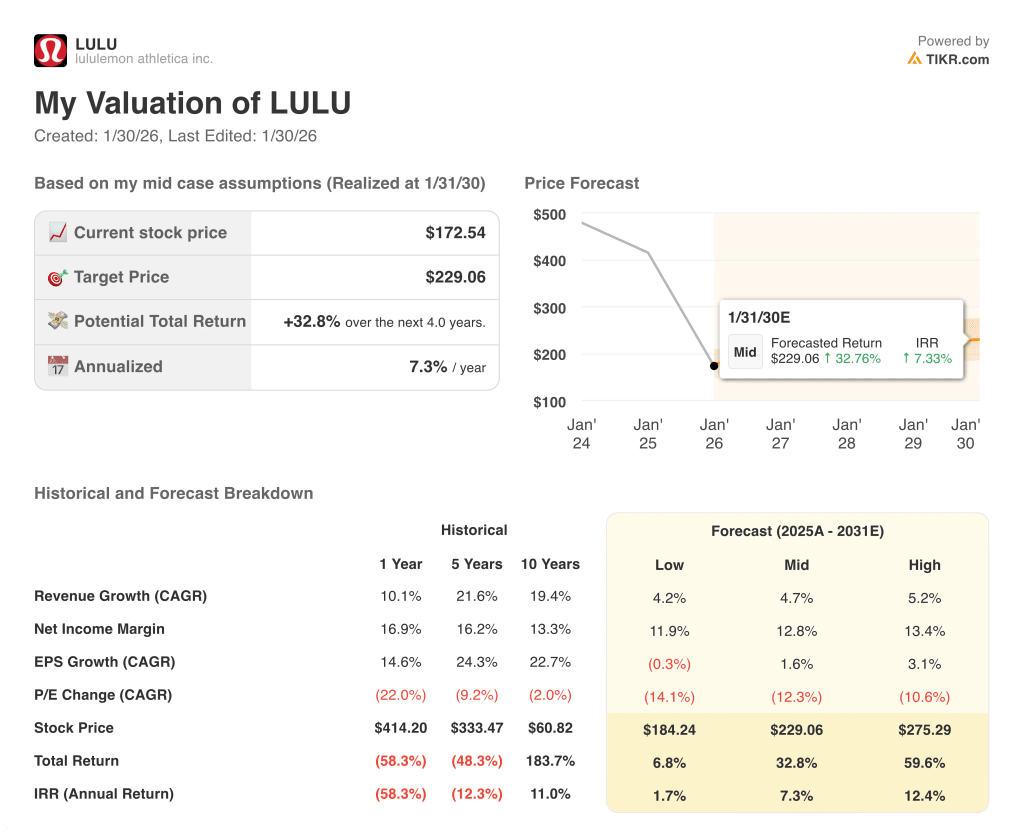
- Low Case: If brand missteps persist and demand stays cautious, revenue grows around 4.2% and margins hold near 11.9% → 1.7% annualized return.
- Mid Case: With product cadence stabilizing and costs controlled, revenue growth near 4.7% and margins improve toward 12.8% → 7.3% annualized return.
- High Case: If international demand accelerates and product execution strengthens, revenue reaches about 5.2% and margins approach 13.4% → 12.4% annualized return.
The mid-case $229 target price is achievable through steady execution and margin recovery, without multiple expansion or speculative sentiment shifts.
How Much Upside Does It Have From Here?
With TIKR’s new Valuation Model tool, you can estimate a stock’s potential share price in under a minute.
All it takes is three simple inputs:
- Revenue Growth
- Operating Margins
- Exit P/E multiple
If you’re not sure what to enter, TIKR automatically fills in each input using analysts’ consensus estimates, giving you a quick, reliable starting point.
From there, TIKR calculates the potential share price and total returns under Bull, Base, and Bear scenarios so you can quickly see whether a stock looks undervalued or overvalued.
Looking for New Opportunities?
- See what stocks billionaire investors are buying so you can follow the smart money.
- Analyze stocks in as little as 5 minutes with TIKR’s all-in-one, easy-to-use platform.
- The more rocks you overturn… the more opportunities you’ll uncover. Search 100K+ global stocks, global top investor holdings, and more with TIKR.
Disclaimer:
Please note that the articles on TIKR are not intended to serve as investment or financial advice from TIKR or our content team, nor are they recommendations to buy or sell any stocks. We create our content based on TIKR Terminal’s investment data and analysts’ estimates. Our analysis might not include recent company news or important updates. TIKR has no position in any stocks mentioned. Thank you for reading, and happy investing!